

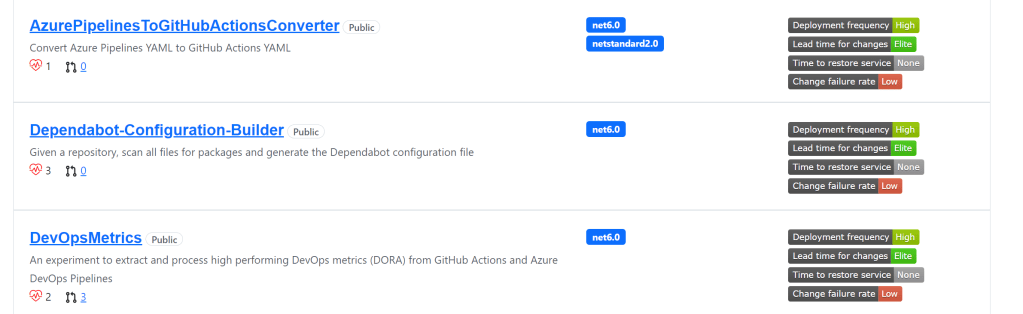
Two years ago, I started a hack to understand DORA metrics on a deeper level, creating a DevOps Metrics project on GitHub. The original plan was to build a tool that could capture and analyze data from GitHub and Azure DevOps – my two primary DevOps tools at the time. In the years that have followed, I am regularly asked to speak about my experiences and what I’ve learned – and I felt this was a good time to publish those thoughts here for everyone. Today we will review the most important takeaways, why I like the DORA metrics, and what each of them mean and how I measured them.

Most important insights
Let’s dive right into the important points first, before exploring the metrics in more detail (I’m assuming you know what DORA metrics are – if you don’t – skip this section, read the rest of the blog, and then return here):
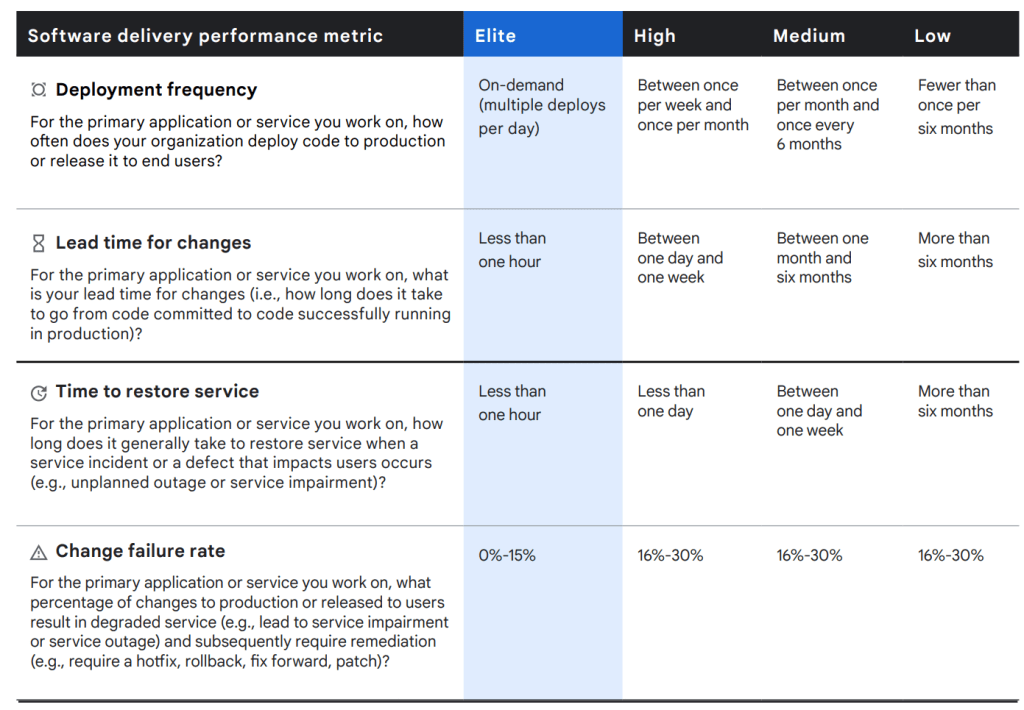
- Initially, when getting started with DORA metrics, specific numbers aren’t that important. It is much more meaningful to understand the order of magnitude – are we are talking hours, days, or weeks for each metric? Using the hours/days/weeks simplification allows us to quickly establish the data collection mechanism on a large number of projects, but not worry about so many details. Does it really matter if your
lead time for changesis 4.5 hours or 4.6 hours? (Answer: not usually). This leads me to next point… - These metrics work best for projects that have a high DevOps investment – what I often refer to as your ‘strategic projects’. I could (and should) write a whole blog post on my definition of ‘strategic projects’, but essentially, strategic projects generate revenue or are critically important to the success of your business. In contrast, non-strategic projects are generally internal apps that you can survive without in the short term. There are a number of benefits to applying DevOps to your strategic projects first. These projects tend to have dedicated team members – if not multiple teams, such as a product owners, scrum masters, and SREs (Software Reliability Engineers). Given these projects are so important, the insights of DevOps metrics can help to identify deficiencies, exposing performance improvements – all of which, (when acted upon correctly), can potentially lead to better results. Great examples of strategic applications are GitHub.com, Netflix.com, Amazon.com – applications that can cause havoc when they aren’t available 24/7 and are critical to each respective companies’ success.
- It’s important to measure the team’s performance, not compare different teams’ performance. The reason we measure DevOps metrics, is always to improve the team performance trends. The goal is not to create competition between different teams. Anytime we start measuring something, it instantly creates incentives – some positive, some negative. Once set goals, users will often aspire to achieve these metrics in the easiest way possible – even if that means cheating a little bit. Added to this equation, every project has different architectures, technologies, clouds, processes, SLA targets, etc – there is too much variability to compare different teams, and little to be gained.
- When applying to projects with a large volume of activity/events, you may need to implement a sampling strategy to maintain performance. Projects running with thousands or millions of workflows a month is a lot of data to ingest. Analyzing every one of these is unnecessary, as well as potentially costly. Many projects won’t have to worry about this insight due to their scale.
Why I like DORA metrics
Over the past 40-50 years of software development, teams have tried a variety of different metrics with varying success. Many of these tended to be one dimensional – think of just a single axis on a graph – we measure one value and hoped to find some insight about the metric, somehow. Examples of popular metrics over the years have been lines of code, number of bugs fixed, story points completed, or even cyclomatic complexity. In contrast, each of the four DORA metrics encapsulate multiple metrics – essentially creating a three-dimensional view.

While DORA metrics aren’t perfect, they are the best solution we have for measuring team performance today. Keep in mind that anytime you measure someone’s work, and especially if you are using these metrics for financial incentives, it is human nature to draw the shortest path to the goal. Some of those are good, some not so good. Lines of code has often been used as an example of a poor metric, as you can add as much value deleting a few lines of code, as writing a few new ones – and our software is complicated enough – we certainly don’t need an incentive that encourages developers to write unnecessary code! The late, great, Abel Wang, shared a graphic a few years ago that highlighted learnings the Azure DevOps team had found with their metrics.
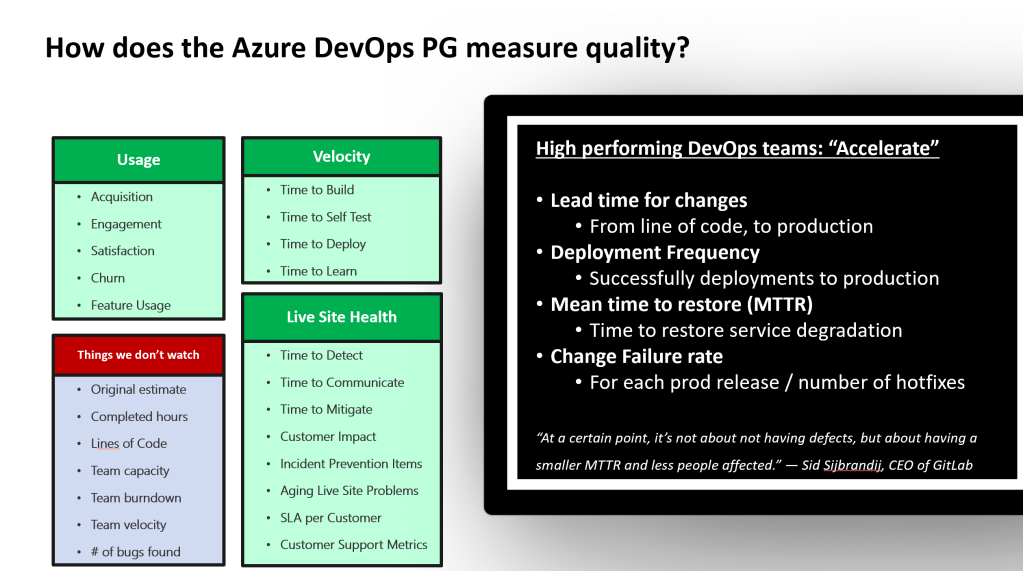
An interesting insight right away, is that in the ‘things we don’t watch’ section, we can see metrics that shouldn’t be measured at a management level. For example, metrics like team capacity and team velocity are ok within a team – but not when comparing two teams. Comparing team velocity between two teams could encourage teams to start inflating story points.
What I’ve learned about each DORA metric
If we look at each DORA metric closer, we also quickly discovered they are more complex than they initially appear to be.
Deployment Frequency
Deployment frequencymeasures the number of deployments. Initially this metric doesn’t sound super interesting – if not a bit broken, as all I need to do is run a deployment once a day and I’m elite, right?! However, when you dive into the description “deploy confidently to production”, suddenly it takes on a new meaning. deploying to production – with changes – requires robust automated testing to ensure we can deploy our changes with confidence.- Deploying to production – with changes, involves robust continuous integration with mature automated testing, good continuous deployment workflows including infrastructure as code, and multiple environments, (at least development, QA, production), that enable you to make these changes with confidence and not demolish production.
Lead Time for Changes
Lead time for changesmeasures how quickly we can make a change and deploy it to production. Even the simplest change, (for example – fixing a spelling mistake or editing a comment- that shouldn’t break anything…), involves at bare minimum automated testing, code reviews, merging feature branches, promoting the code between environments, any QA/leadership/regulatory signoffs. We measure all of these things – mostly from a process perspective, to get that change to production.- I’ve had quite a few debates about when to start measuring lead time for changes. Should development be included? What about Pull Requests (“PRs”)? My take is that development is a design and implementation task and varies greatly – it’s why estimates are so often wrong. Have you ever heard an estimate for “10 minutes”, and then watch the task take hours and hours, if not days? I initially started measuring this metric from the first commit in a branch. Today, I think it’s important to abstract away development and design change variabilities, and start measuring from the last commit, and then measure the entire PR process, merge and push through non-production to production environments. Note that the goal isn’t always to release to the end user – it you have feature flags the feature might be not enabled, but deployed and ready.
Mean Time to Recover (or MTTR)
Mean time to recoveris about measuring the time to recover from an outage. Immediately we can see that MTTR is a tricky metric, in that there is so much variation between the definition of an outage. Did my data center fall into the ocean, or is it just a degraded SQL index? Adding to this, is the nearly infinitely combinations of technologies, architectures, and clouds used across every project. The implementation of this metric has the most amount of customization today.- My implementation monitored specific events with Azure Monitor, and I tracked when a degradation or outage started via Azure alerts, and then when the Azure alert was resolved. This allowed me to customize monitoring per application on what I believed was most important. Usually this involved watching CPU or memory usage of various services, sometimes it was simply website availability (any 400 or 500 HTTP errors), another time monitoring the length of a queue. Azure Monitor was useful in that I could really monitor anything I wanted.
- Note: keep in mind that MTTR has been used in a number of different contexts, depending on the technology and solution, including:
- Mean Time to Remediate (usually in a security context)
- Mean Time to Respond
- Mean Time to Repair
Change Failure Rate
Change failure rateis all about measuring the success of a deployment. Did the website work perfectly after the deployment or did it crash? Similar to MTTR, the question is question ‘when is a deployment to blame for a failure?’, was the challenge with this metric. If a website fails to load immediately after deployment, this is obviously a change failure. What if a change creates a memory leak that isn’t apparent for a few days? What if a change causes a database degradation that slowly gets worse, or only appears at certain times? How do we decide a deployment is a success or failure, when there are multiple deployments happening sequentially one after the other or multiple times in a day?- Obviously, we need to take all of this into account, but for these reasons: I’ve found this metric the most challenging to automate, the human element here creates a number of challenges. My solution was to I assume every deployment was a failure, and then manually mark it as a success if I found no issues later. Not a great solution, and a little negative, (I’ve been meaning to reverse the logic to make it ‘more positive’ – assuming a deployment is successful and then marking if it failed).
Summary
Hopefully this information is helpful – but I’d love to keep the conversation going: I’m curious about your opinions of this article. What do you agree with? What do you think could be better? How did you solve some of the issues I ran into? I have continued to build upon the DevOps Metrics project over the years, incorporating it a number of side projects, but I do believe there is a large opportunity – and plenty of possibilities to contribute further and help the usage of DORA metrics grow!
As a wrap up, I wanted to acknowledge and say thank you to the original creators of the 2016 DORA report, Alana Brown, Nicole Forsgren, Jez Humble, Nigel Kersten, and Gene Kim. I don’t know any of these people personally, but none of this wouldn’t have been possible without their hard work and visionary innovation.
I also wanted to thank Helena Jackson and Chris Hanna, former colleagues who helped me get my initial DevOps Metrics hack off the ground two years ago.
References
- DORA (DevOps Research and Assessment): https://cloud.google.com/devops/
- My DevOps Metrics project: https://github.com/samsmithnz/DevOpsMetrics
- Featured Image reference

One comment