

Continuous Monitoring, or “CM”, is a critical tool in helping create an effective DevOps pipeline. We’ve prioritized features, developed, built and tested the features, released them to production – but how do we know if the features are working the way we think they are? Are our users actually using the new features or are they encountering bugs we didn’t detect earlier in testing? Can we use monitoring to help prioritize our next features? These are all important questions we need to answer with monitoring. Today we are going to:
- Add Application Insights to our web service to monitor telemetry
- Add monitoring to our Azure DevOps dashboard and annotations to each release
- Learn about how to use Application Insights
Adding Application Insights to Visual Studio
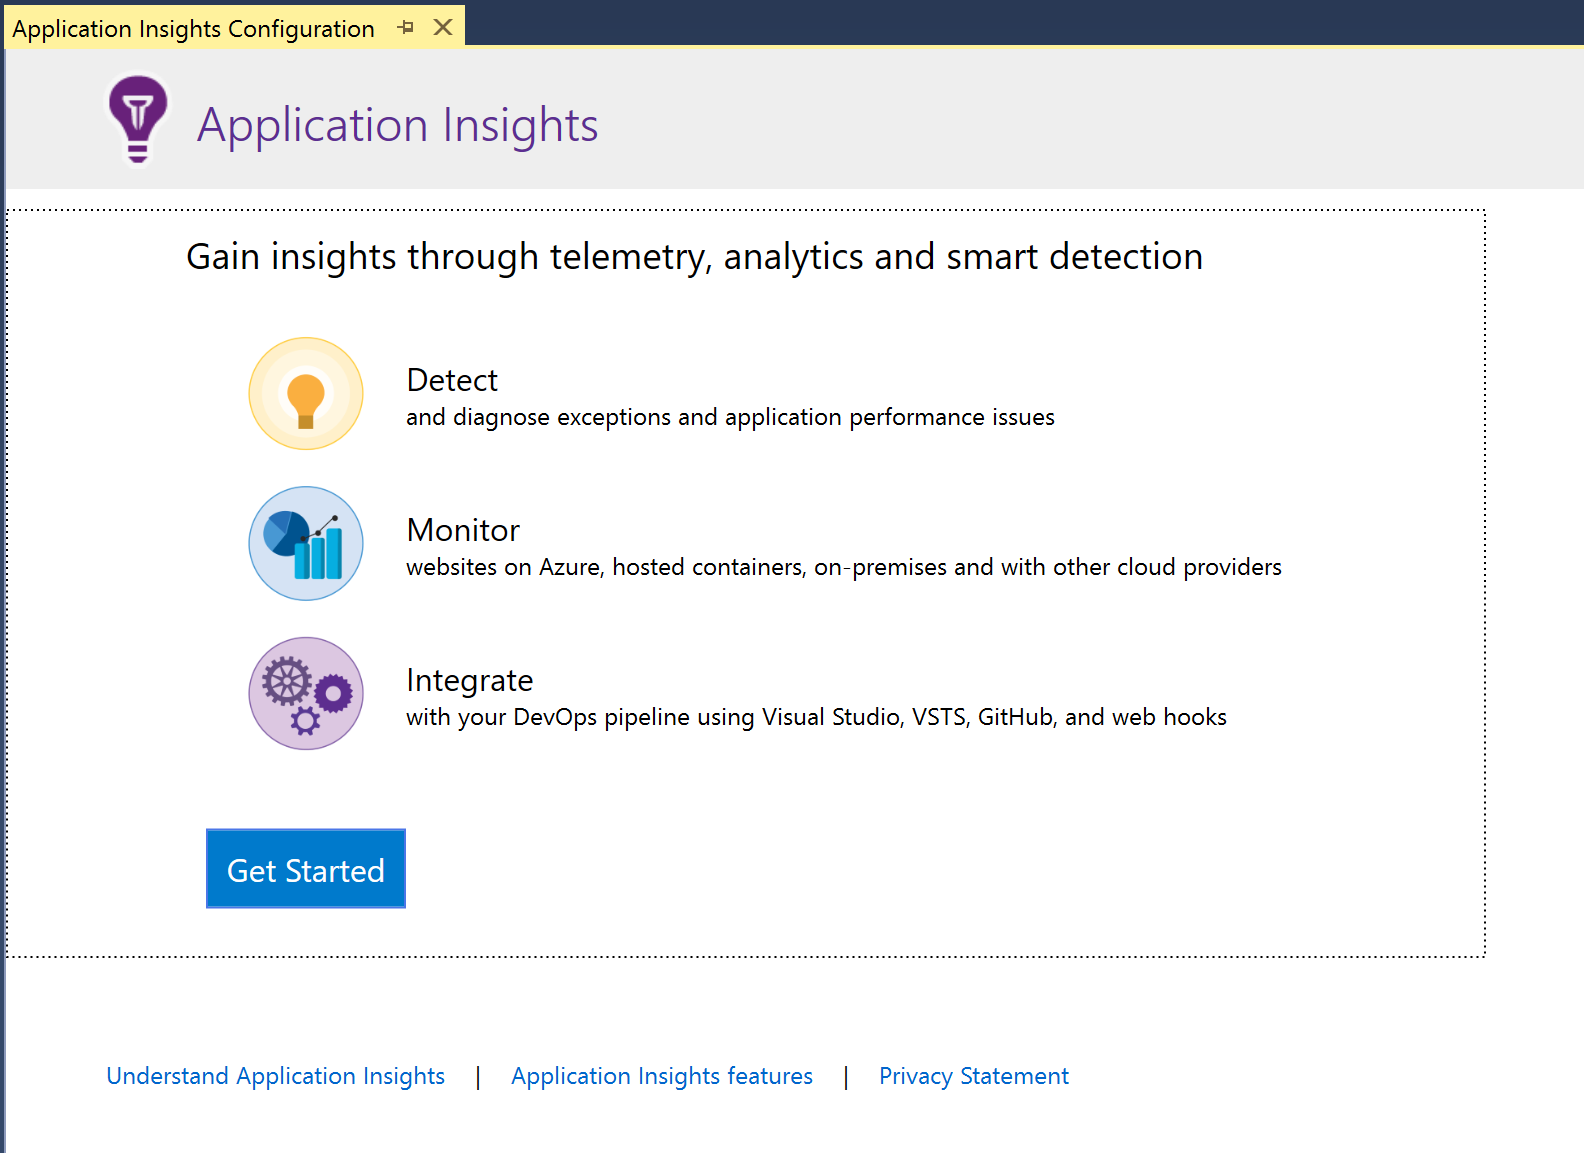
Application Insights is used to monitor your web applications, returning analytics for performance, errors, and usage. Application Insights, for minimal effort, can likely make the biggest impact to your applications today – especially if you do not currently have a monitoring solution. Additionally, setup is very easy.
To setup Application Insights, we start with our regular workflow and create a branch in Azure Boards off the feature we are working on, then check out the branch in Visual Studio. We right click on the project “SamLearnsAzure.Service”, and select “Add”, then choose “Application Insights Telemetry”.
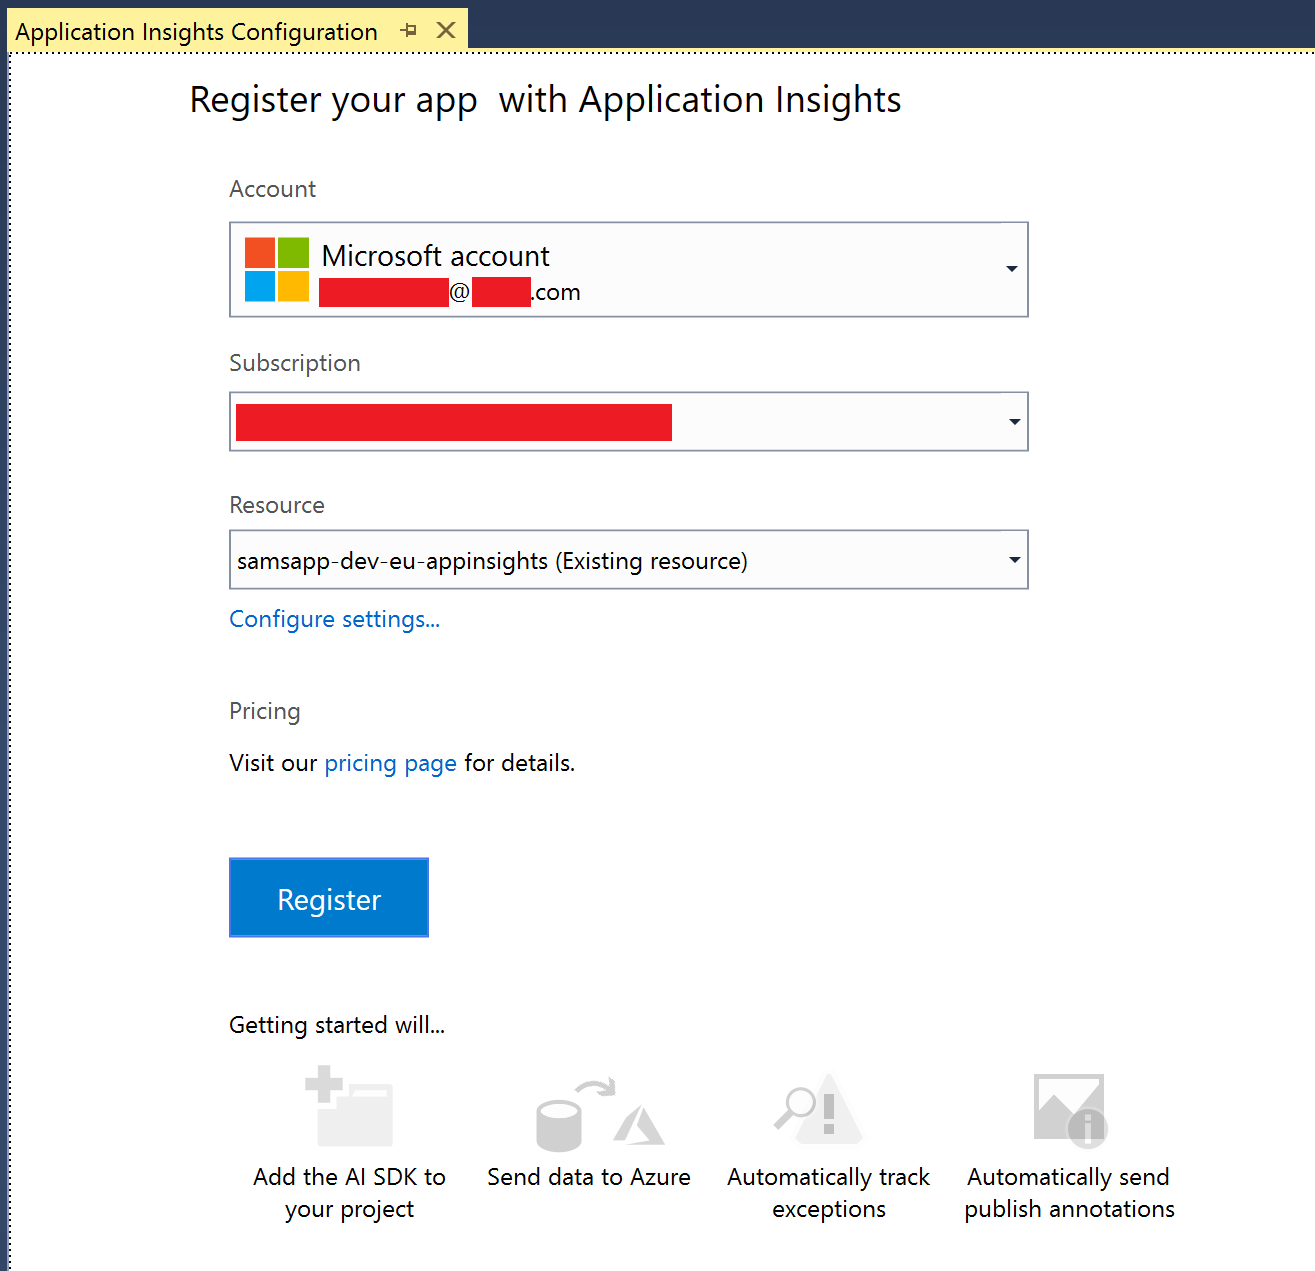
We then register the application with our account, subscription, and target our dev instance of application insights that we created with our ARM Templates. As we move through this process, we will later target each environment in Azure Pipelines to configure Application Insights for each release.
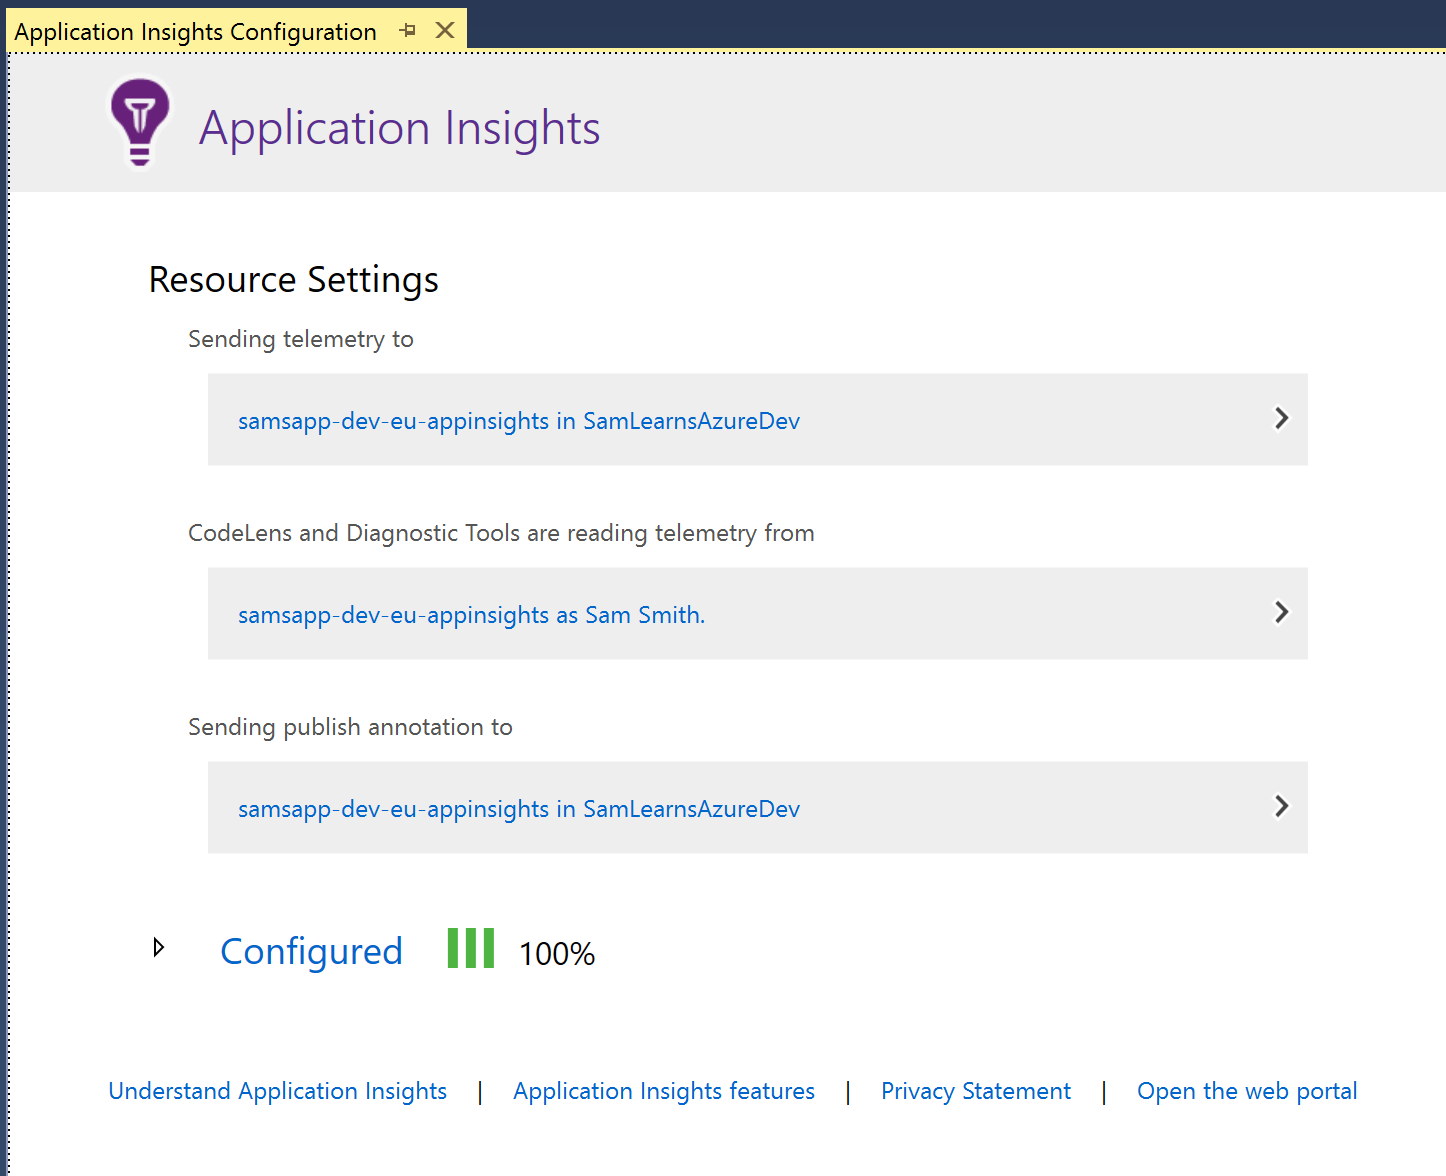
The result shows that Application Insights has been successfully configured.
At this stage, it’s a good time to update the Application Insights NuGet package to the latest version – this unlocks some useful features such as “Live Metrics” later! (The default Application Insights NuGet package is a little old).
Adding Application Insights to our project also added a line to our Program.cs file, which we can see in the screenshot below on line 23.

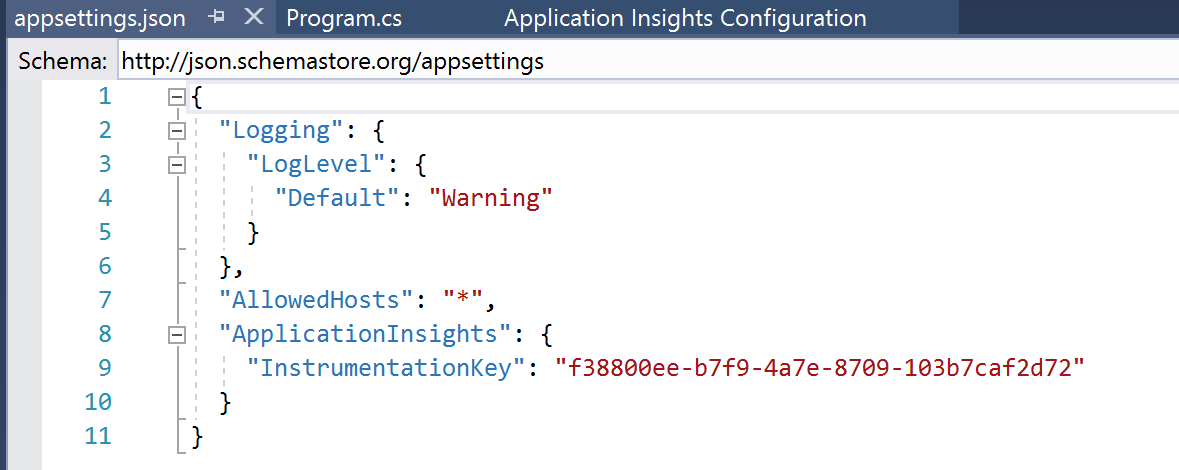
This also added a few lines in our appsettings.json file, with an guid assigned to the “instrumentationkey” item – this guid is a reference to our dev environment. This is what we will reconfigure in our release template later. That is all we need to do to setup Application Insights, so we commit and push our changes to the Azure DevOps, running and completing a Pull Request to merge these changes into the master branch.
Updating the release for Application Insights
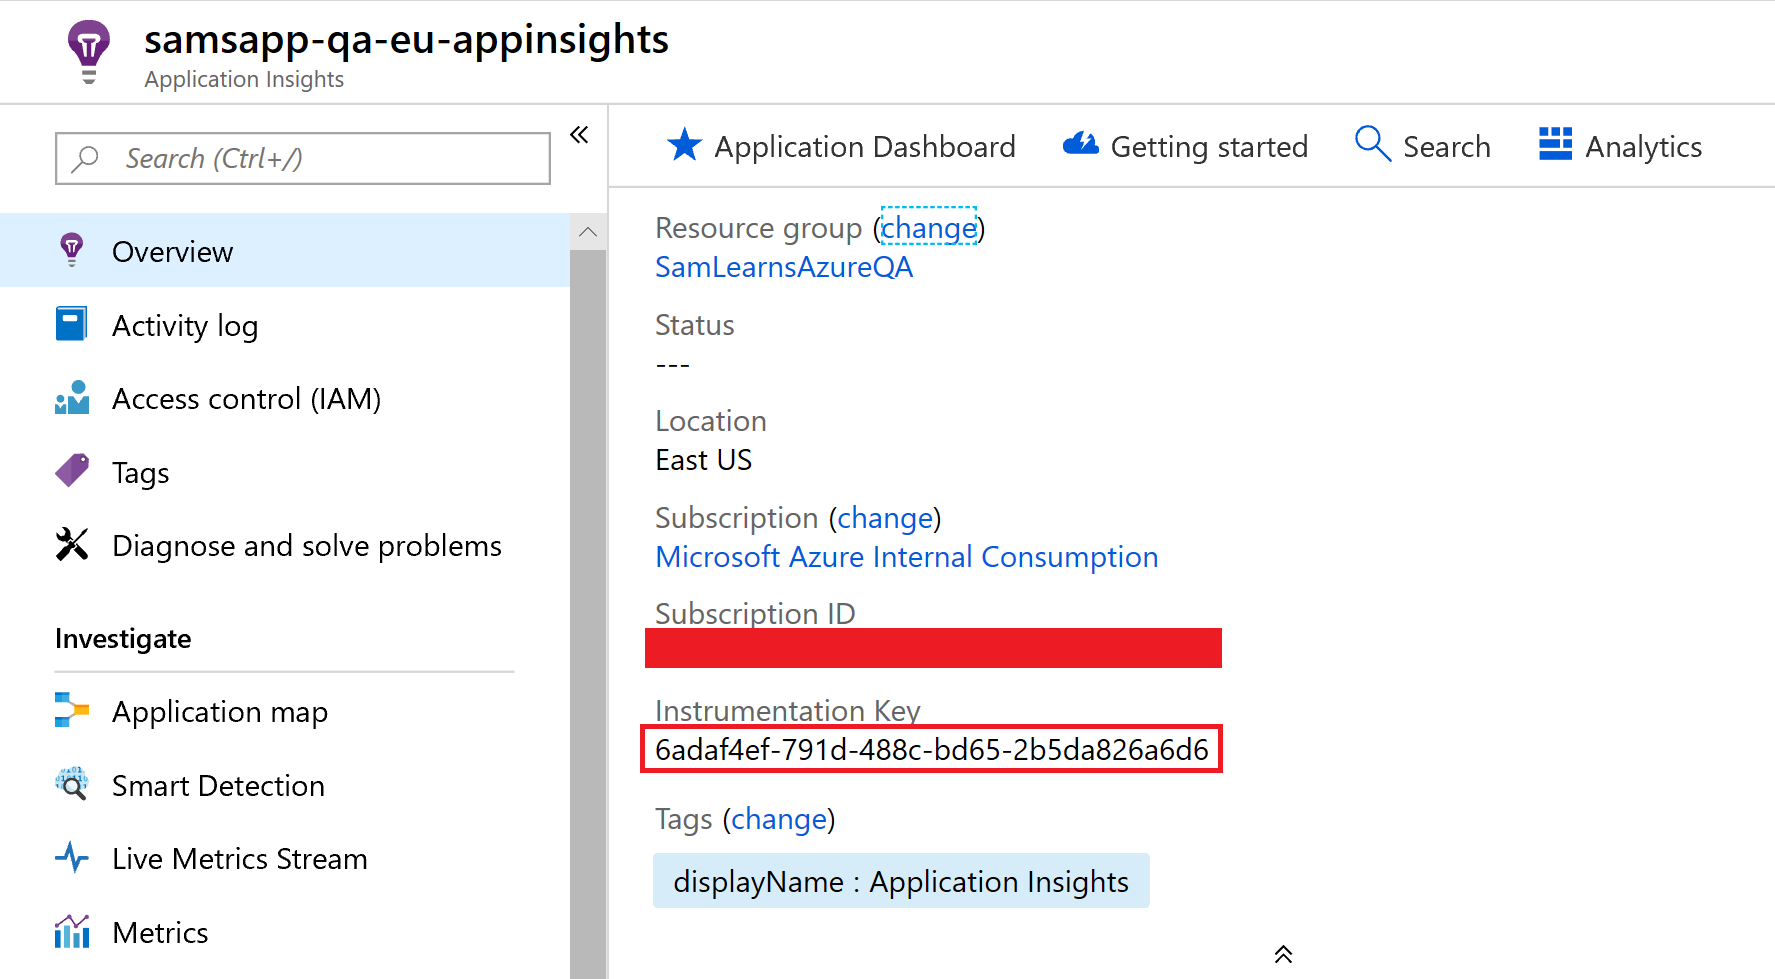
In our Azure portal, we browse to each Application Insights instance and make a note of each instrumentation key.
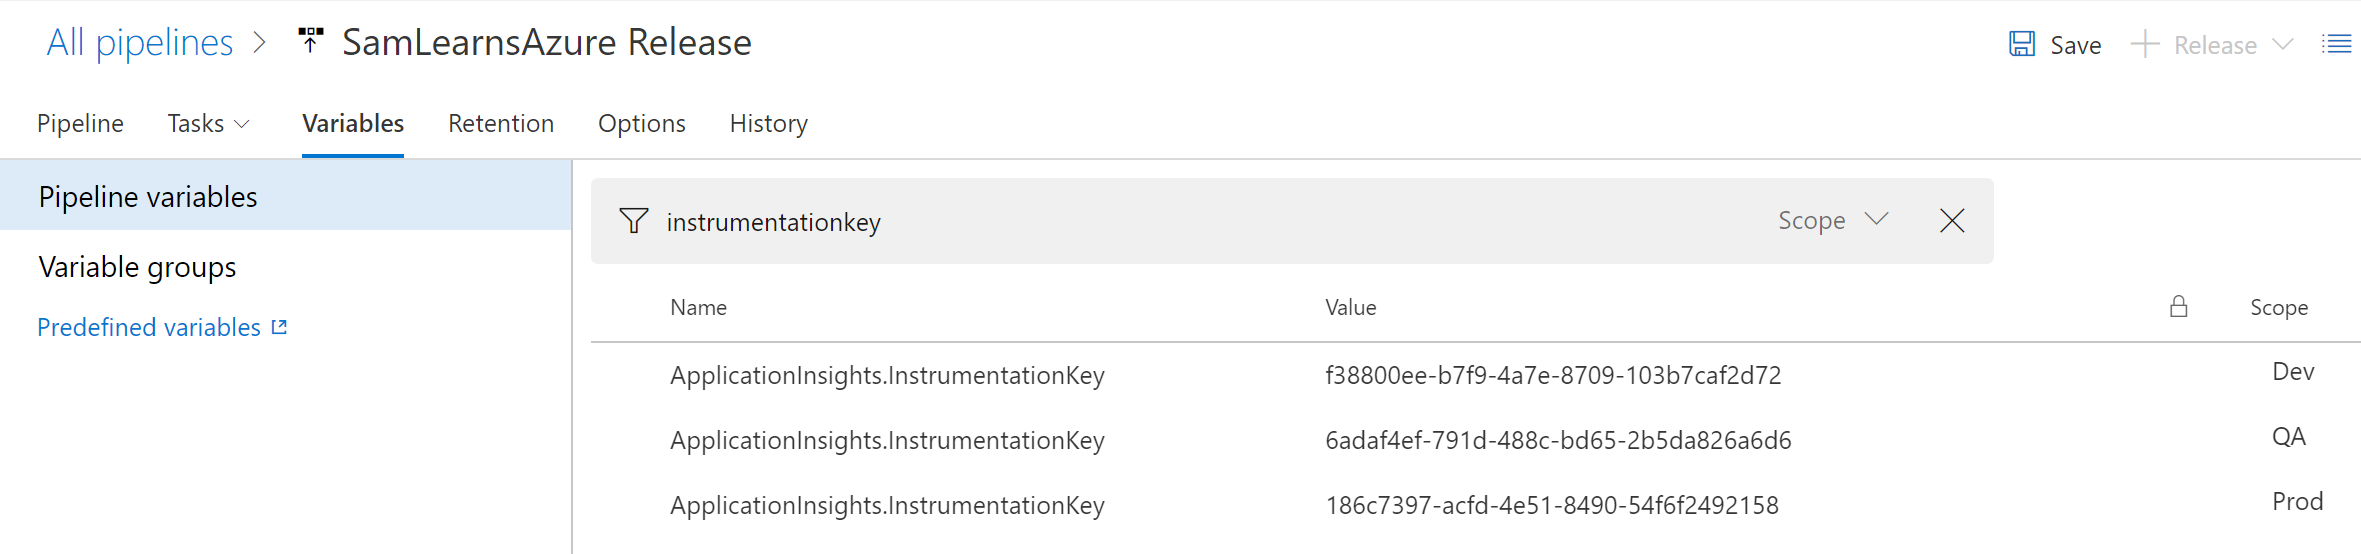
In the Release pipeline variables, we add a new variable for each environment, configuring the scope for each environment (so the Dev scope deploys that variable to the Dev environment), and then use the “.” to separate parent and children relationships in the appsettings.json document. For example, as InstrumentationKey is a child of ApplicationInsights, we use the format “ApplicationInsights.InstrumentationKey” – this will find the “ApplicationInsights” parent, then child “InstrumentationKey” and assign the value to it.
We create a new release and watch it finish successfully. We then browse to each of the 3 Application Insights instances and confirm they are successfully receiving requests.
“Single Pane of Glass” application monitoring
One disadvantage of Application Insights is that it is buried in the Azure Portal. Not all users need to dive into the deep analytics available, and just need a general snapshot of health. In Azure DevOps, we can create a dashboard with a “Single Pane of Glass”, a single place to view all important things in our applications life cycle. Here we can add various widgets to view build history, release history, and monitoring.
Build History widget
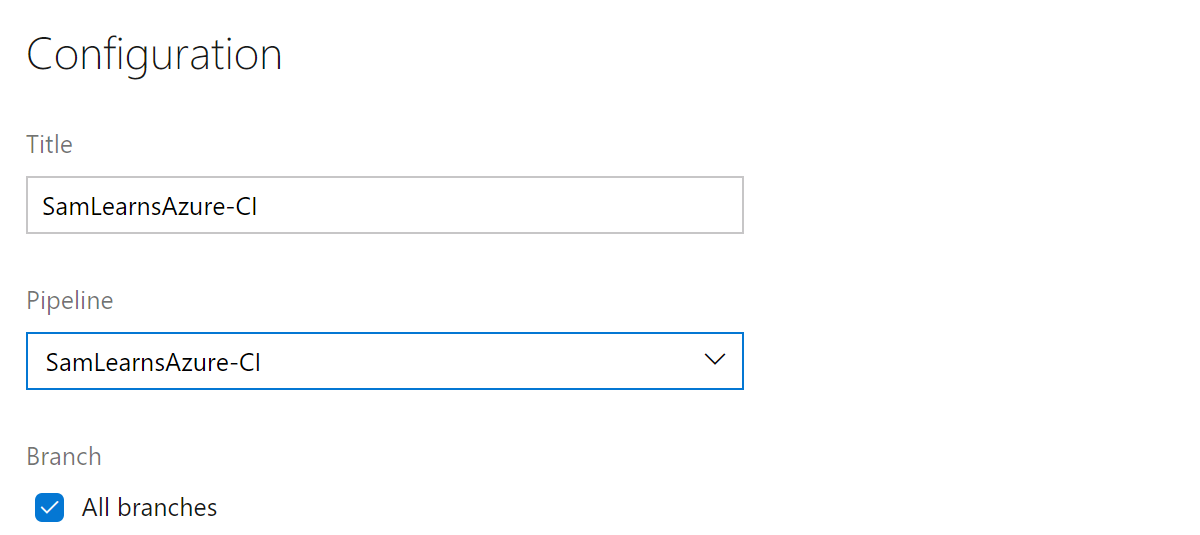
The “build history” widget is relatively simple to setup. We just need to select the build “Pipeline” and select all branches – as we want to see all build issues in all branches.
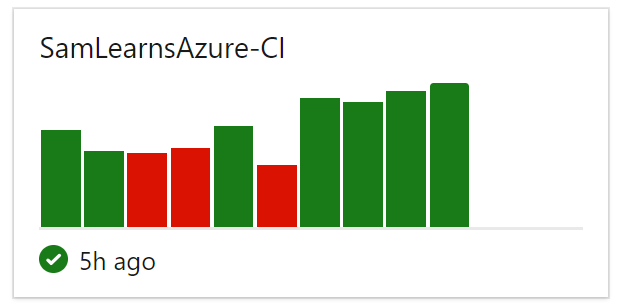
This displays the status of the last ten builds, with relative time shown vertically, and the result, indicated by color: green is successful, yellow is partially successful, red is a build failure.
Release Pipeline widget
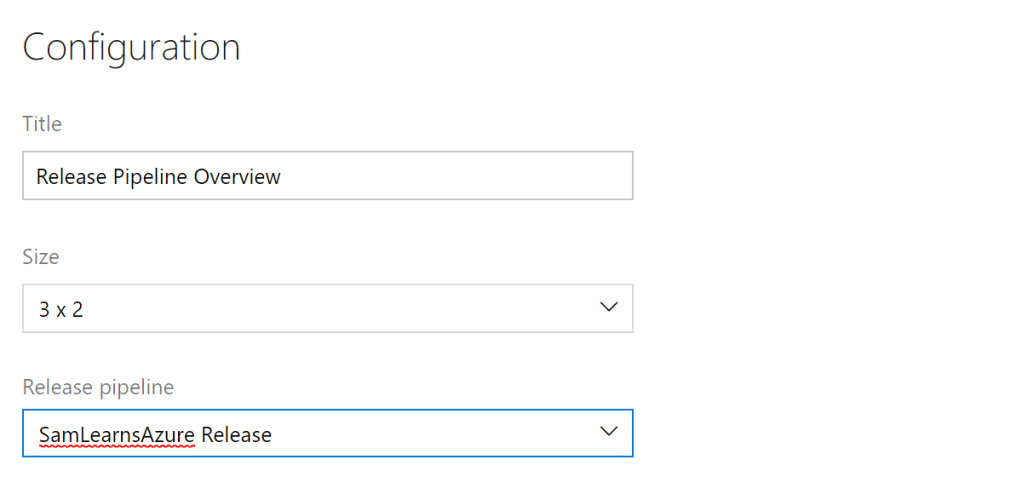
The “release pipeline” widget is also relatively simple to setup. We recommend a “3 x 2” size, unless you have more than 3 environments, in which case it should be made bigger.
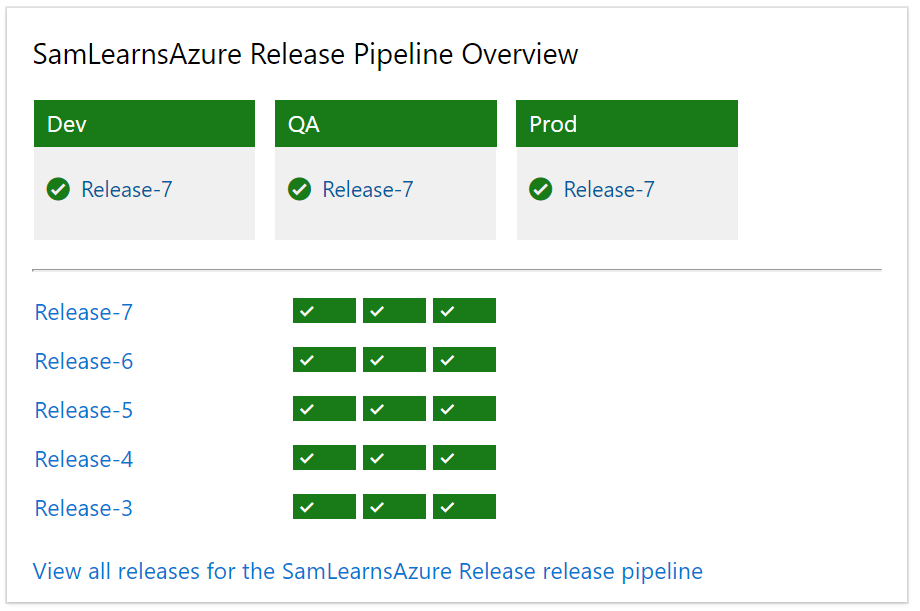
In the widget we can see which release has been deployed to each environment, and a history of the last 5 releases. Similar to the build history widget, the result, indicated by color: green is successful, yellow is partially successful, red is a failure.
Azure Application Insights Chart and Metrics Widgets (Optional, but recommended, addition)
We recommend that you add the “Azure Application Insights Widgets” market place item. Note that to install, you will need to be an Administrator in your Azure DevOps instance. This is a great widget to help with monitoring. The only downsides are the purple color schemes and setup – but we are going to help mitigate setup here!

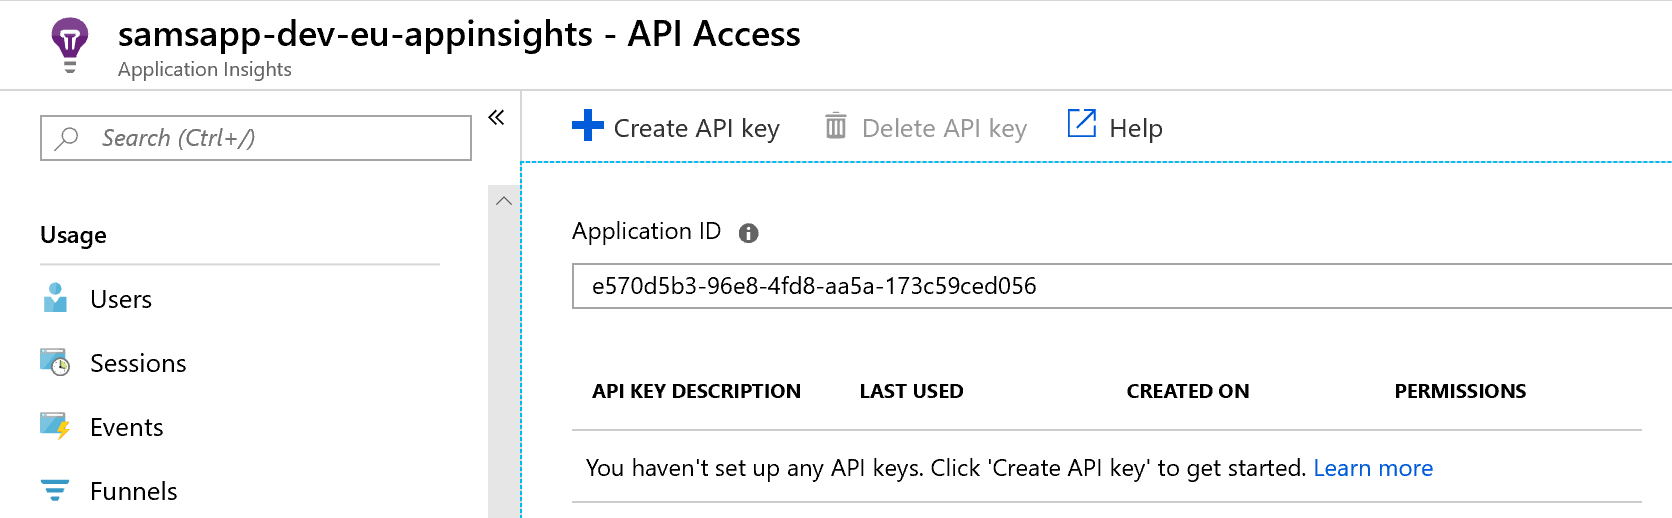
To use this widget, we need to open each of the Application Insights instances, and in the configure section, find the “API Access” menu item. Make note of the Application ID on this page for later and then click the “Create API Key” button.
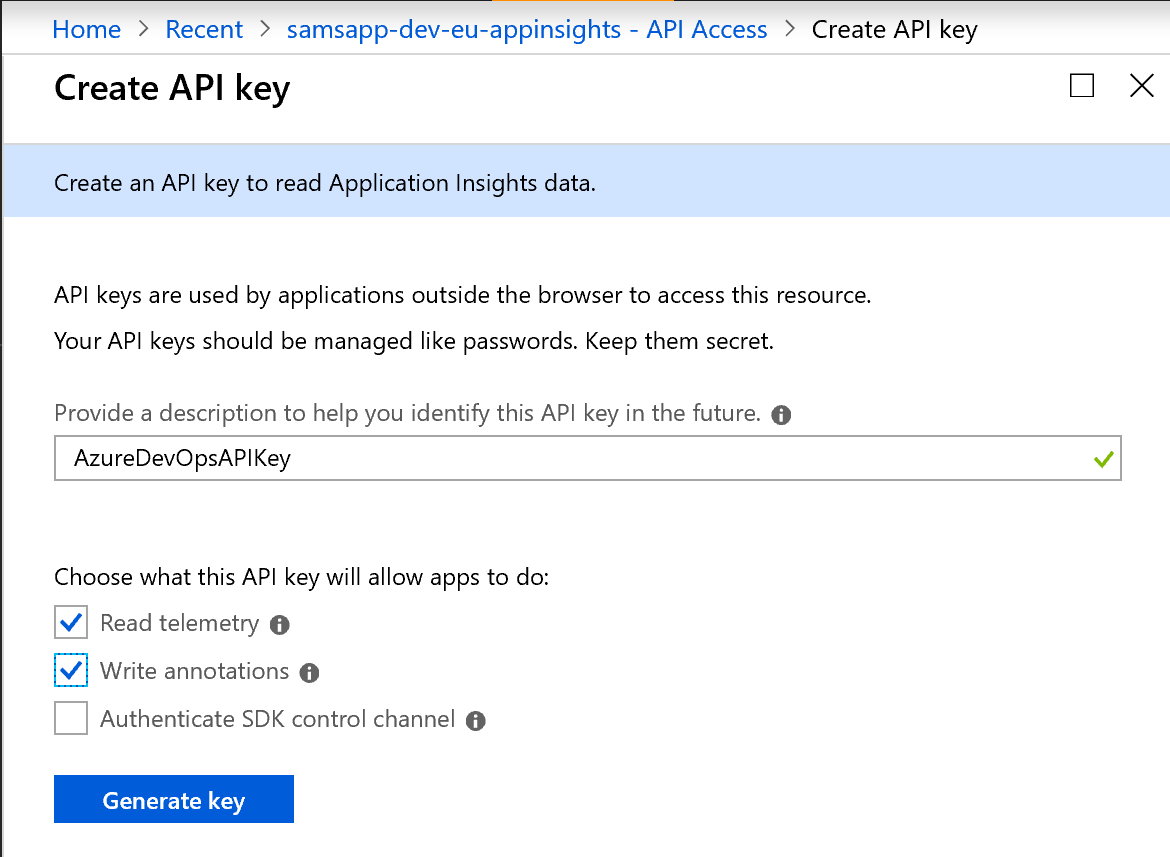
Add a name of the API Key, checking the “Read telemetry” and “Write annotations” check boxes and then click “Generate Key”. These features allow the API key access to read and write Application Insights to/from Azure DevOps.
On the “Create API key” page, make a note of this key.

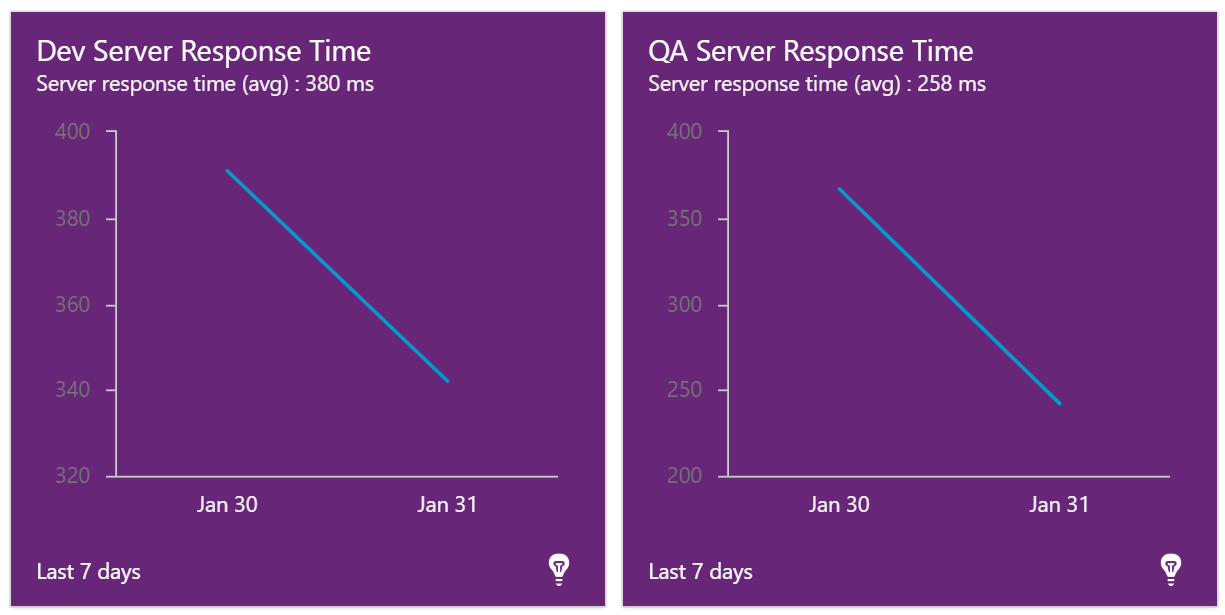
Next, back in the Azure Devops dashboard, we add a “Azure Application Insights Chart Widget” for each environment. This is where we need to paste in the “Application Id” and “API Key” we extracted from our Application Insights instances. We are going to use the “Server response time” metric, and the “Time range” of 7 days. This will give us a good overview of our application performance.

The resultant (unfortunately purple) chart that shows just 2 days of data (we only just deployed our application code connecting to Application Insights yesterday!).
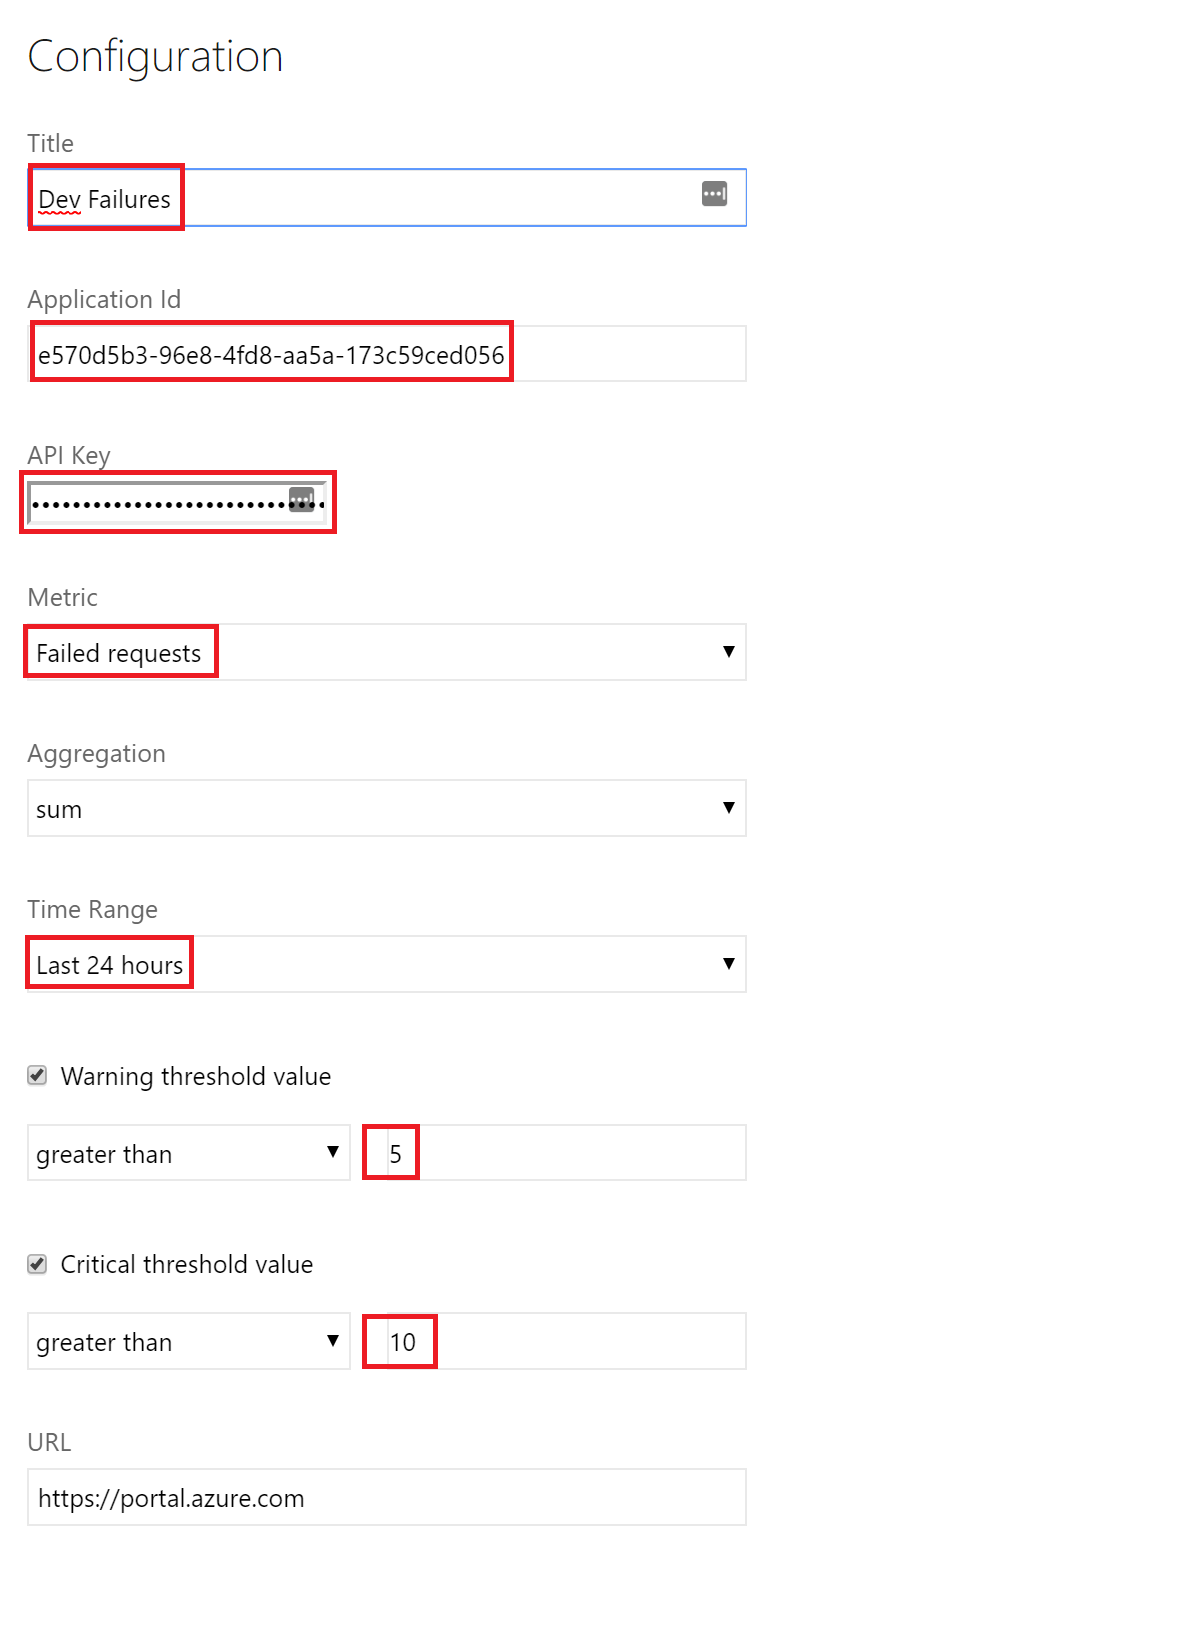
We are going to add two more “Azure Application Insights Metric Widgets” for each environment (for a total of six). We are going to use the metric of “Failed Requests” and “Dependency Failures”. For this metric, we are just going to look at the last 24 hours, and use the warning and critical thresholds. These are neat, if it’s over the warning threshold, the widget changes to an orange color, if it’s over the critical threshold, it changes to red. We set these slightly different for each environment – for Dev we are more forgiving using a warning value of 5 and a critical value of 10, but for production we are more strict, using a warning value of 0 and a critical value of 5.
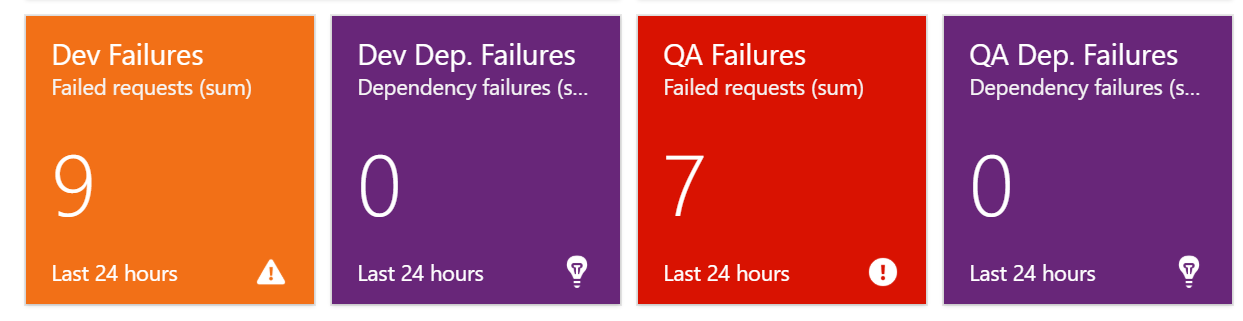
The resultant metrics shows our dev and QA metrics, with the failure count triggering the warning color in dev and and error color in production.
Our completed dashboard
Our resultant dashboard looks like this, with our builds, releases, and monitoring – all in one screen – a “single pane of glass”. We will continue to add to this as we add more components, but this is a great start! Note that there are some errors here we weren’t aware of – the API is failing when we access the root page, (e.g. not calling a specific controller/action), and the favicon.ico file is missing from the service. These are minor and easy to correct, and is exactly why Application Insights is so important. While this isn’t affecting an end user today, tomorrow it could. In a previous project there was an example where there were over a thousand errors being generated an hour we didn’t know about and weren’t being logged into the event log. We add these errors to our backlog and will fix these errors in another post.

Release Annotations (Optional, but recommended, addition)
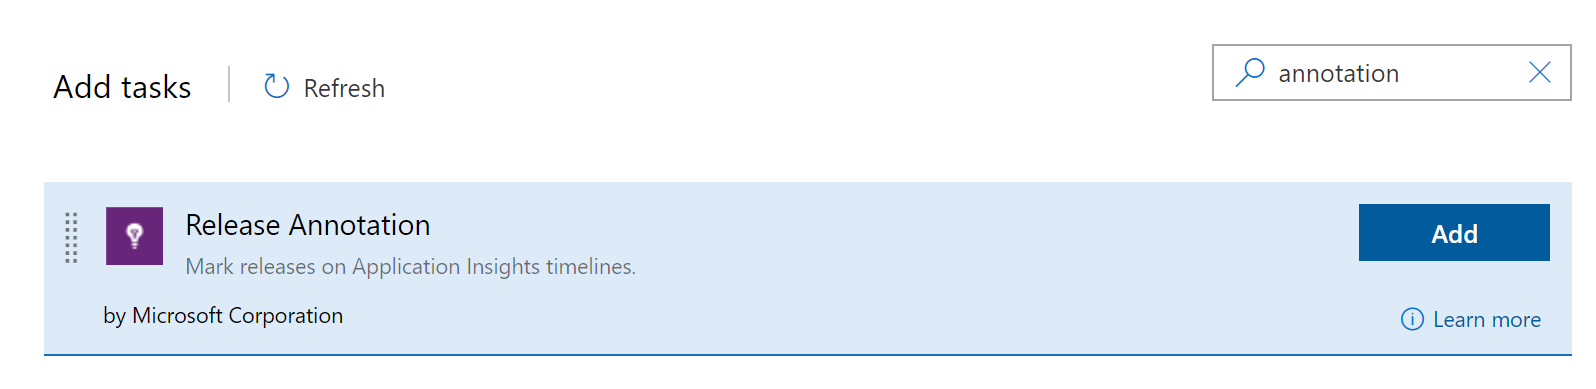
Release annotations allow us to add markers in Application Insights to note when we completed a release. If we see a change in performance after a release, it’s easier to narrow down the cause of performance degrading, a change in failures, or any other Application Insights metric change- as there is a clear indicator of when a change was made. To use this, we need to add the “Release Annotations for Azure Application Insights” marketplace item. Note that to install, you will need to be an Administrator in your Azure DevOps instance.

Similar to the “Single Pane of Glass” section above, we need the Application Insights Application Id and API Key. Fortunately we setup our API above to write annotations and can continue to use the same API information. We add these to the Pipeline Variables, as shown in the screen below, marking them all as secrets so they can be used by our release tasks.

Next we add the “Release Annotation” task to our release.
We are adding the task last, after the slot swap, as we want to record the release after it has successfully completed all other tasks. In the Application ID and API Key text boxes we use the variables we created on the previous step

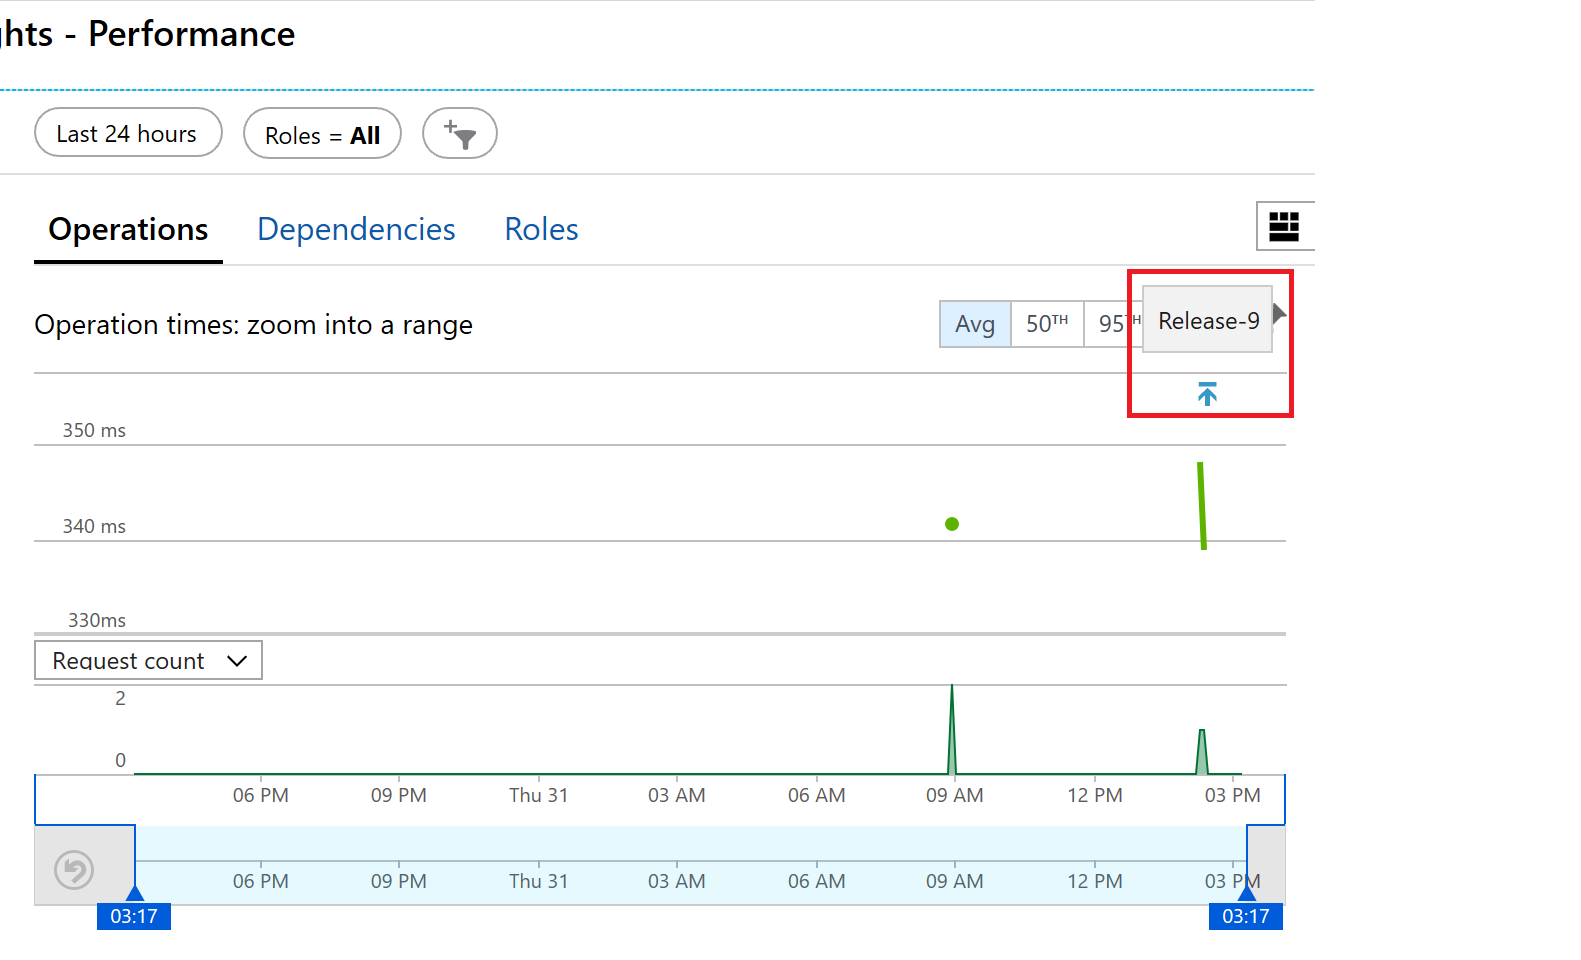
With the new task added and configured, we queue a new release. Once the release is complete, we can see the result in Application Insights, and can now have more information to troubleshoot performance changes. In our screenshot below we can see the annotation indicating we just released “Release 9”.
How to use Application Insights
There are a number of pages available in Application Insights, but in our opinion, the 4 most important features are:
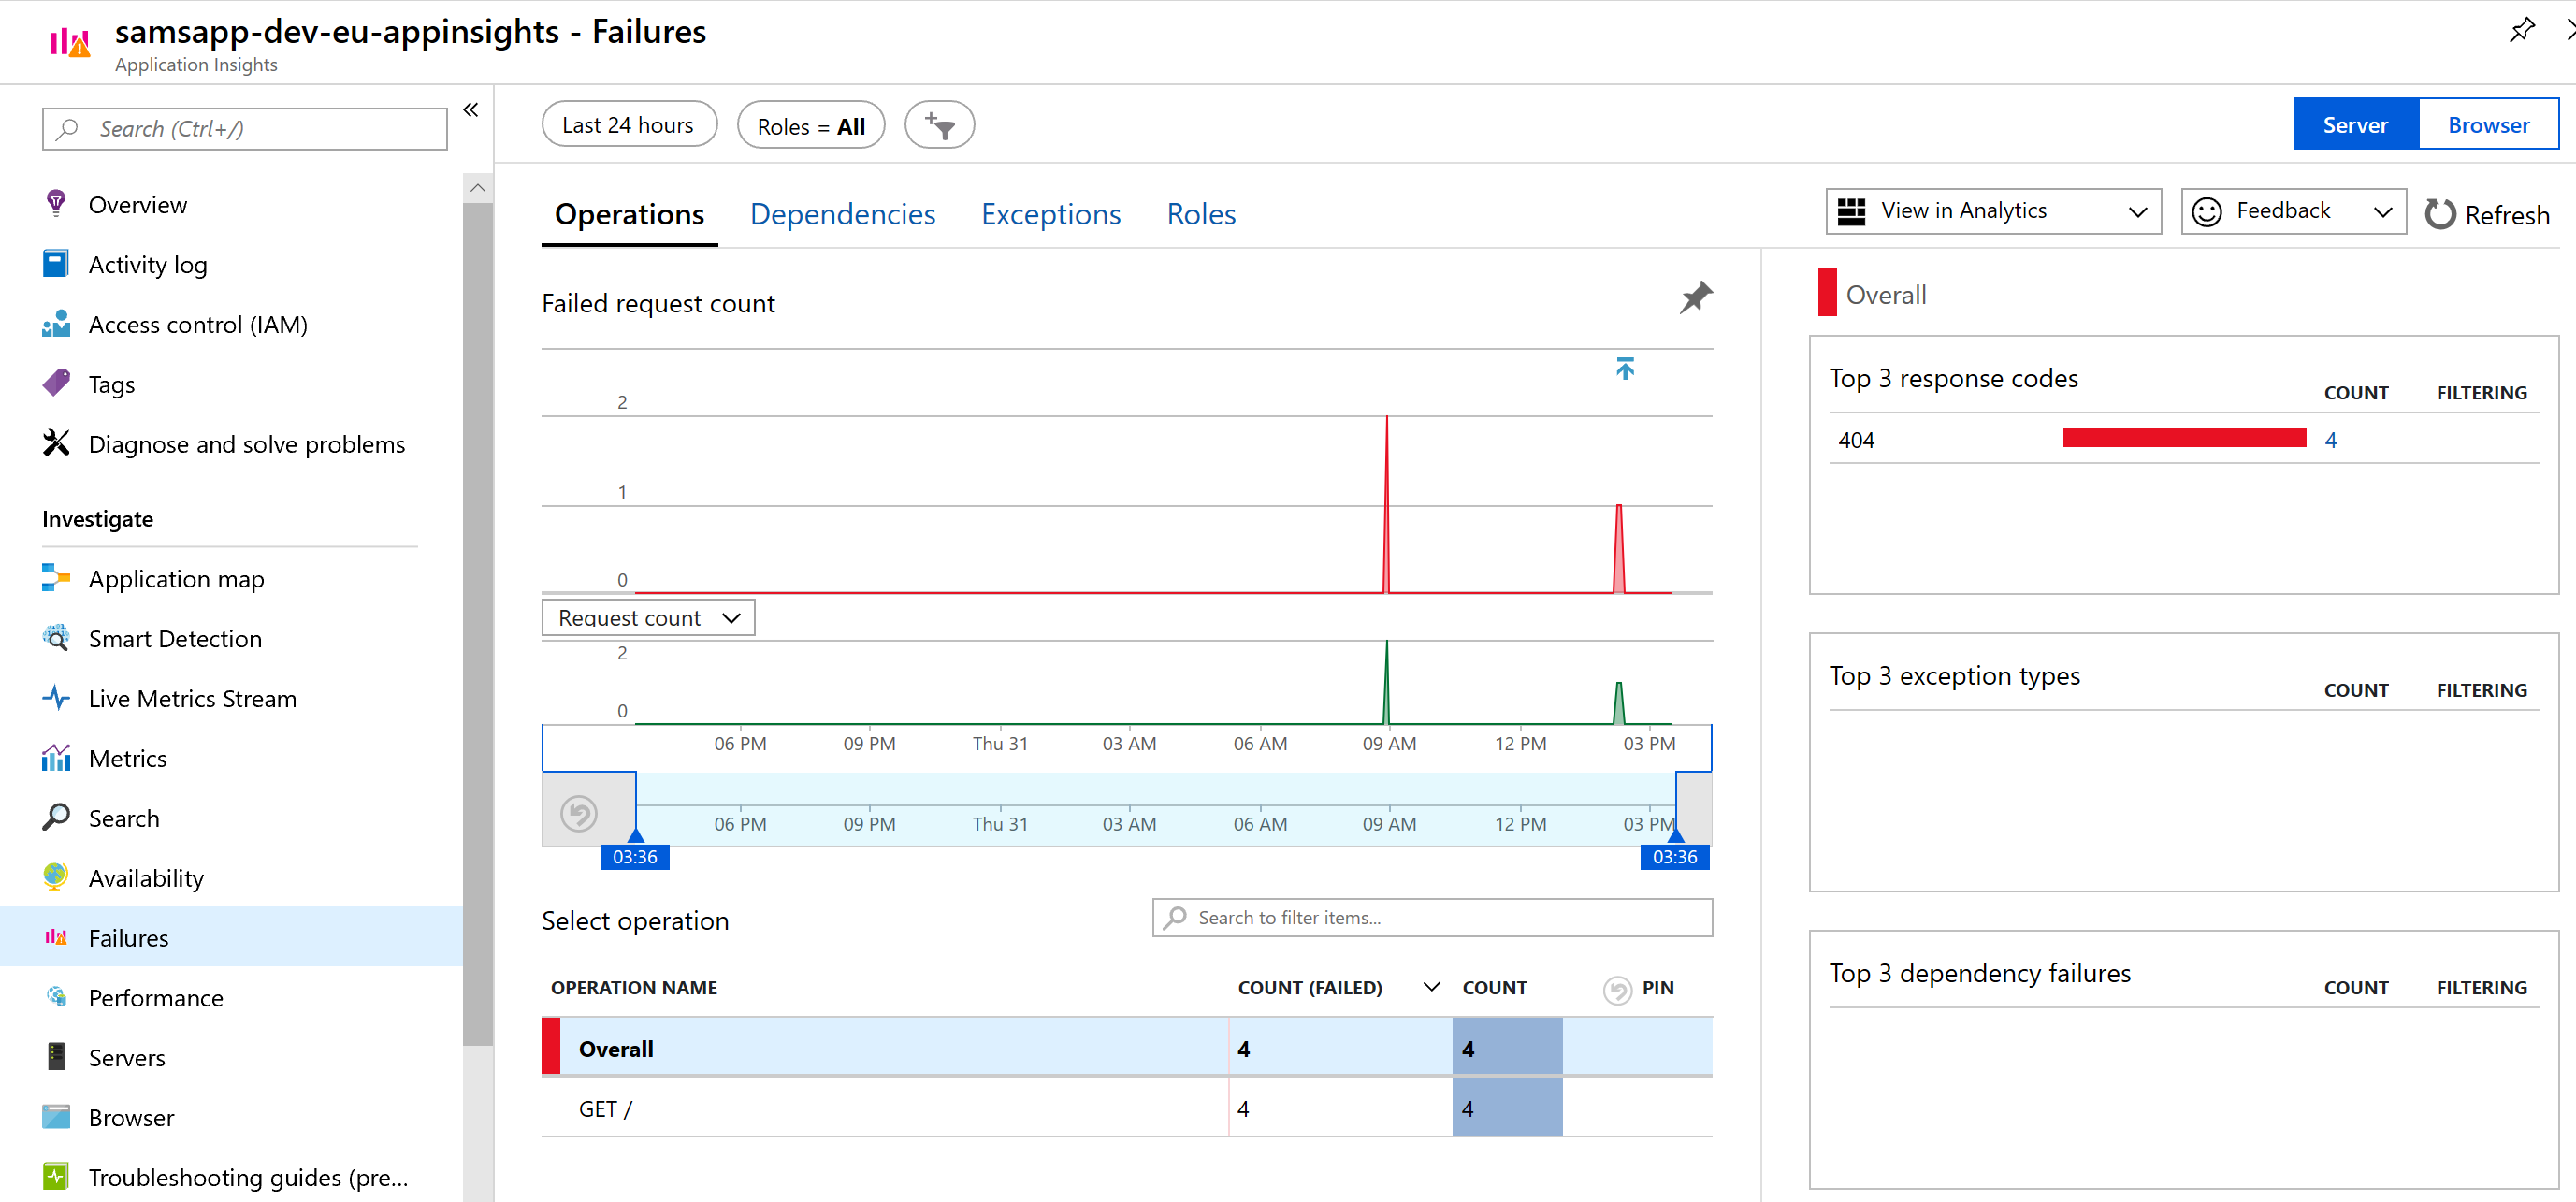
Failures: observe errors – often errors you did not know were occurring. In our case, we have our 404 error to investigate.
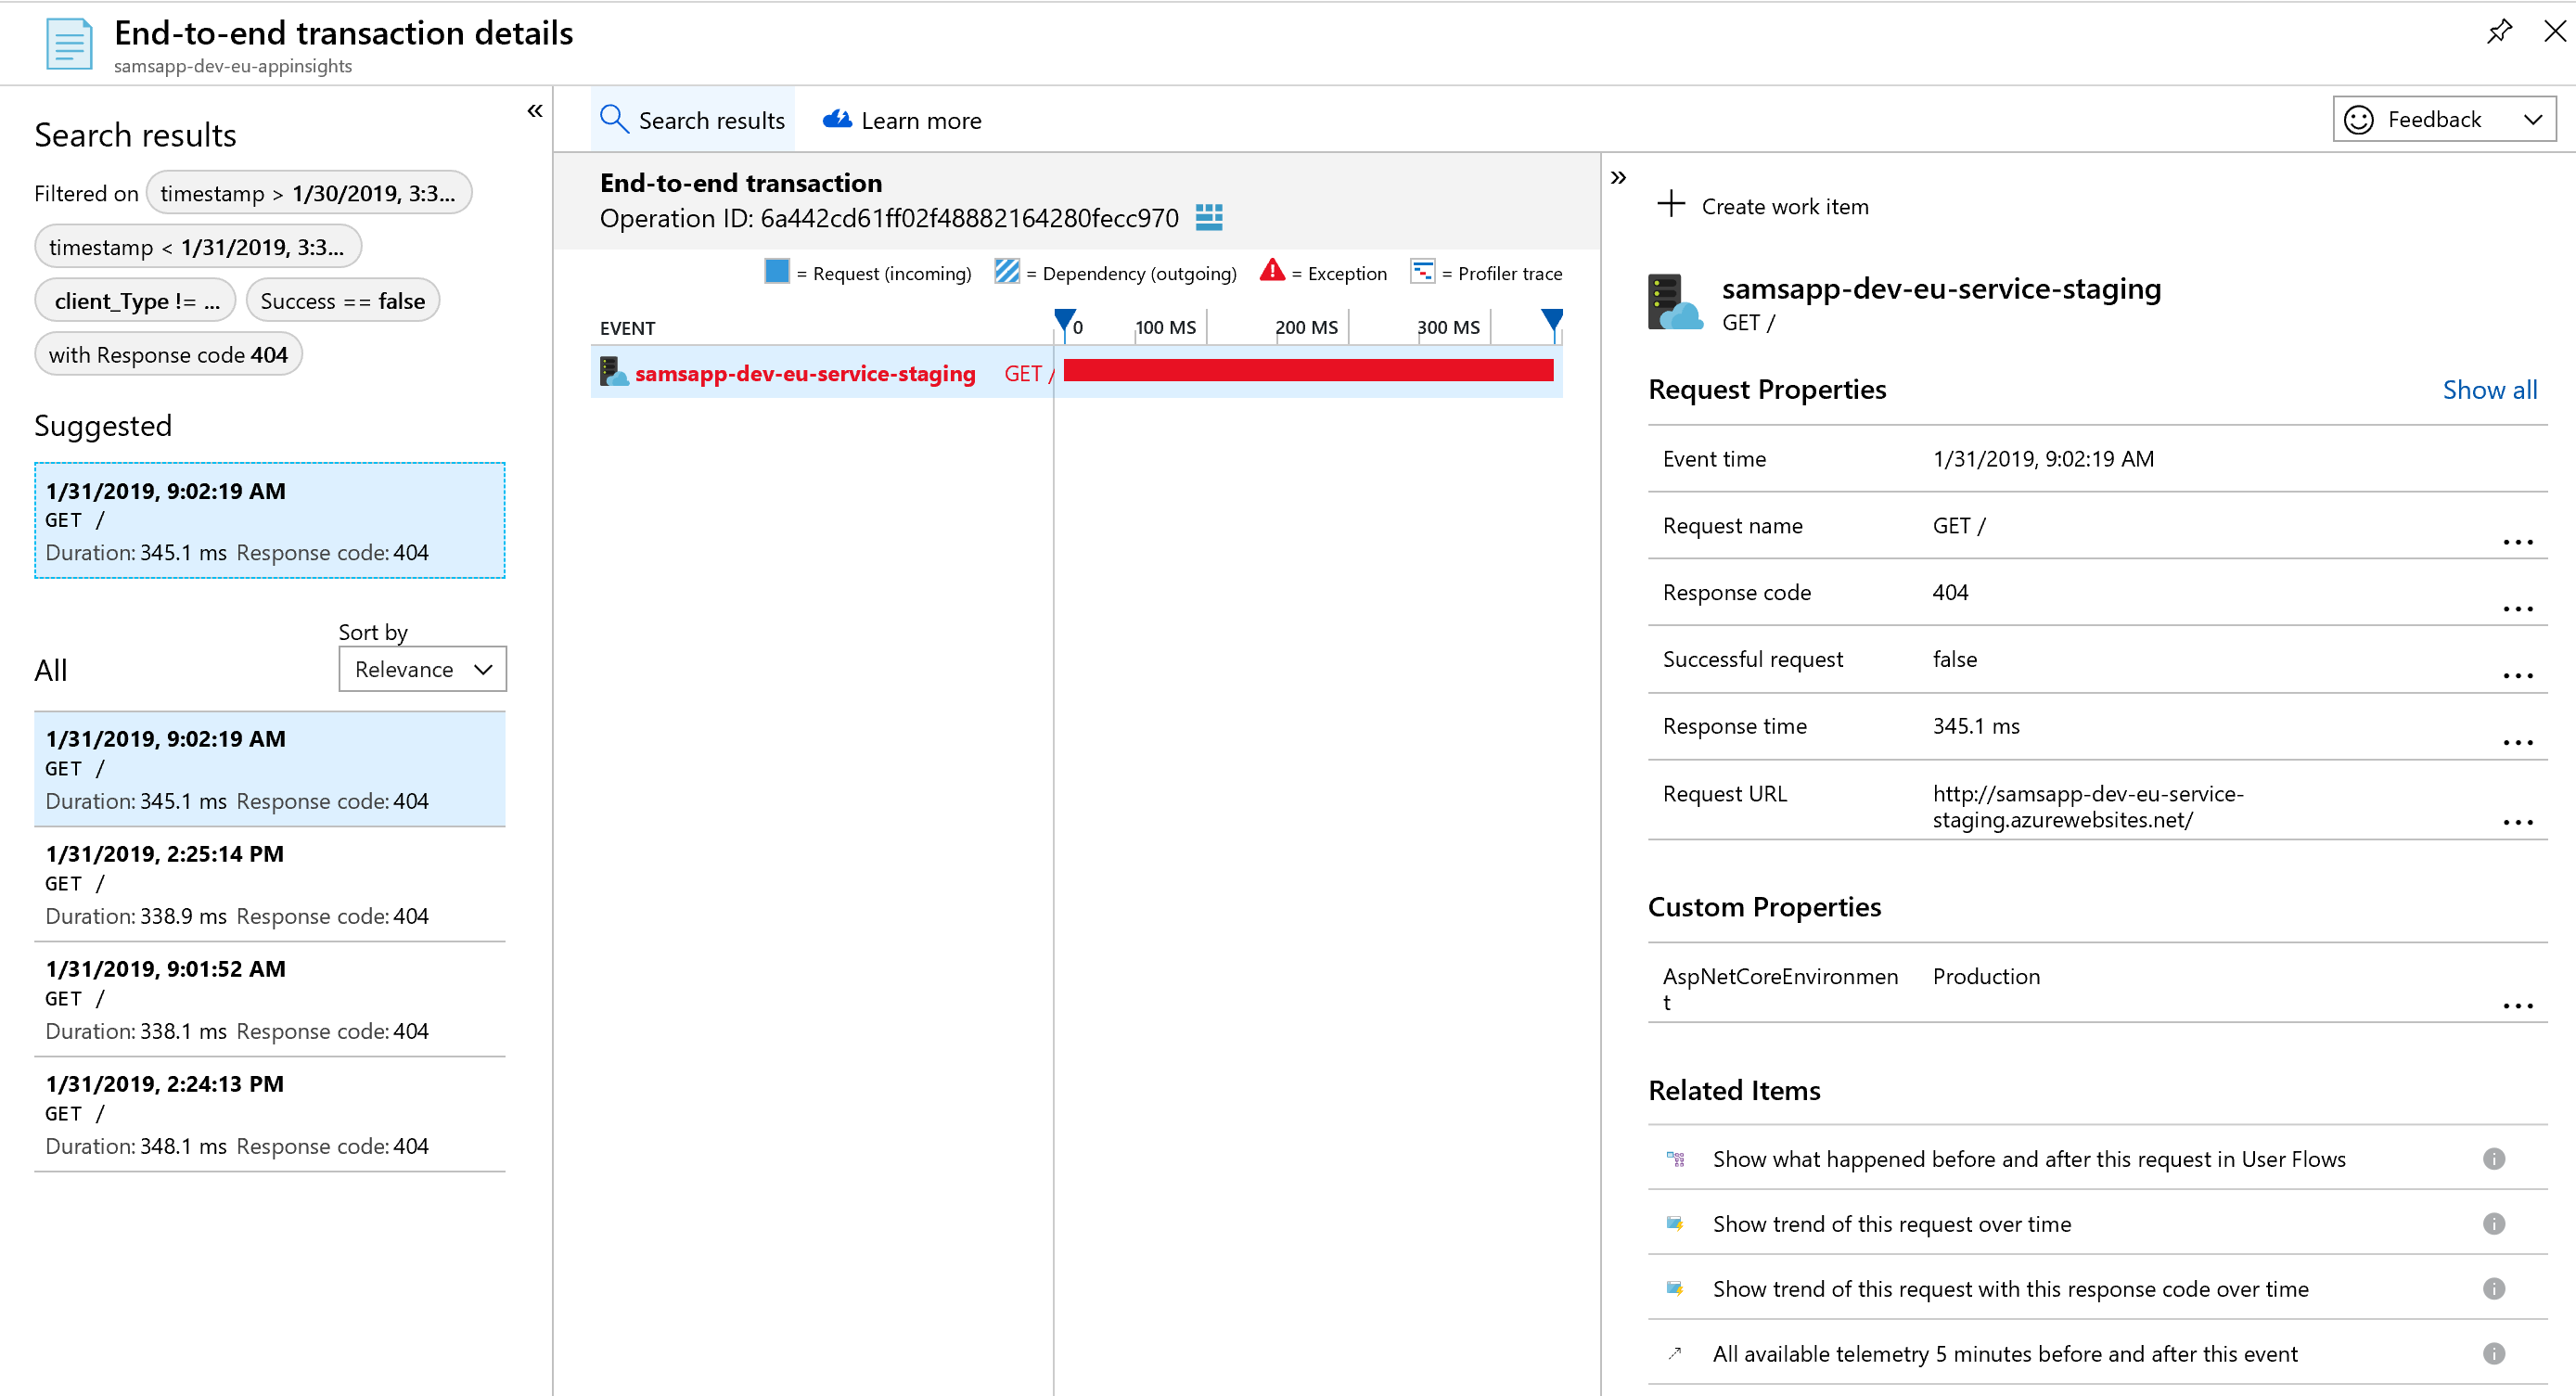
We can dig into the error by clicking on the 404 area on the right to display exact details about the issue. We can see the event time, the response code, request url, and many other details. The request url in particular is very helpful in replicating this error.
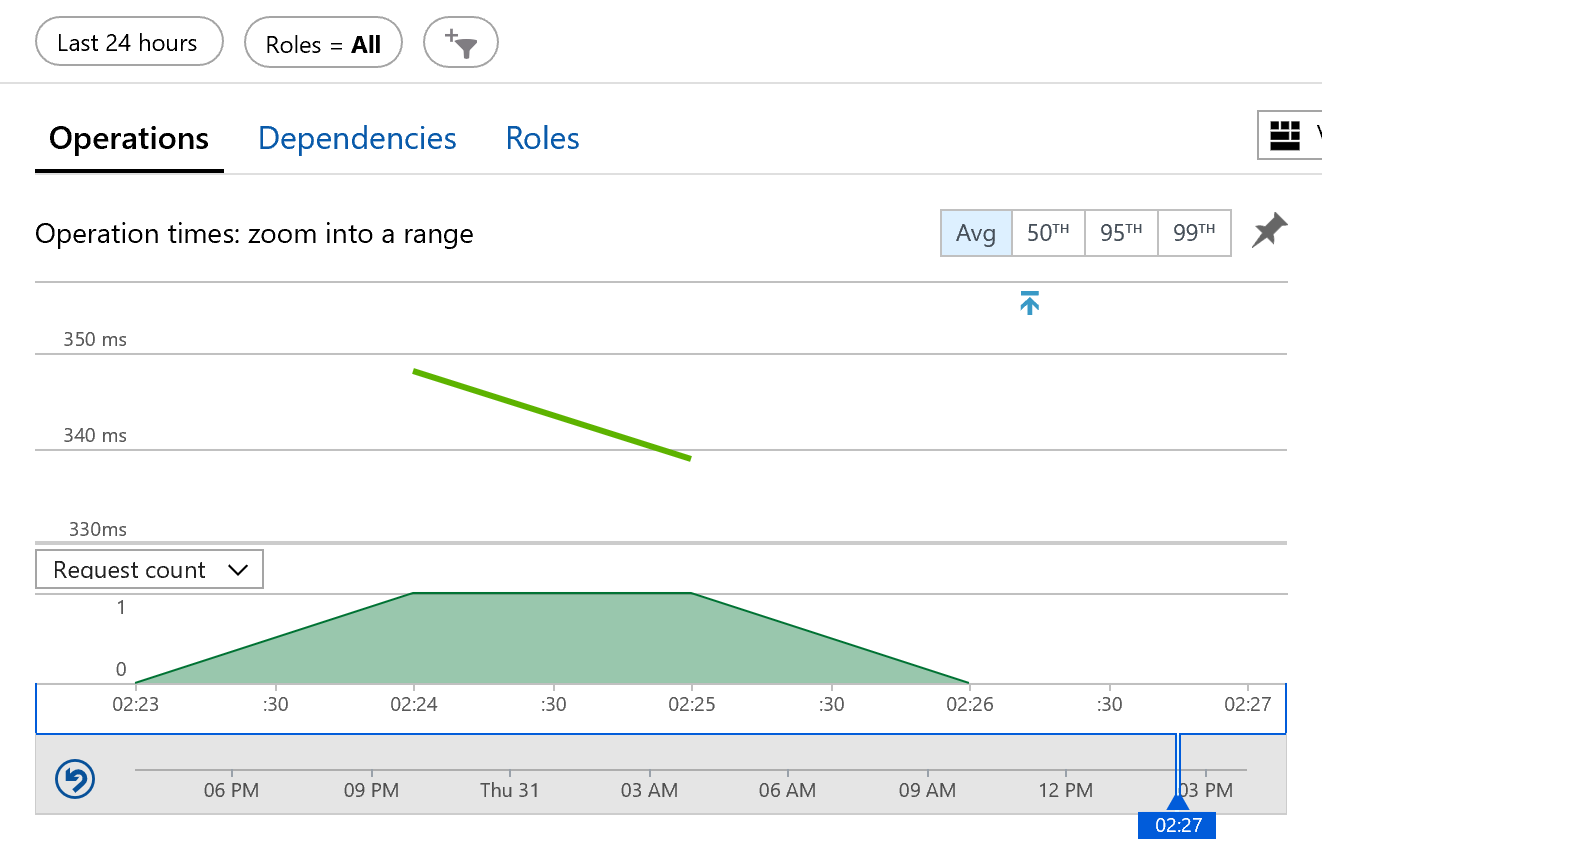
Performance: observe how long pages are taking to load. Here we can get real information about performance bottle necks and understand what pages need optimization. Not only is the operation duration important, but the count, which helps to give us an idea of the volume. If we are trying to decide if we should fix the page that loads in 20s, but was only loaded 10 times, and the page that loads in 10s and was loaded 10,000 times – I’ll always look at the pages with the higher volume, as these are likely affecting more users.
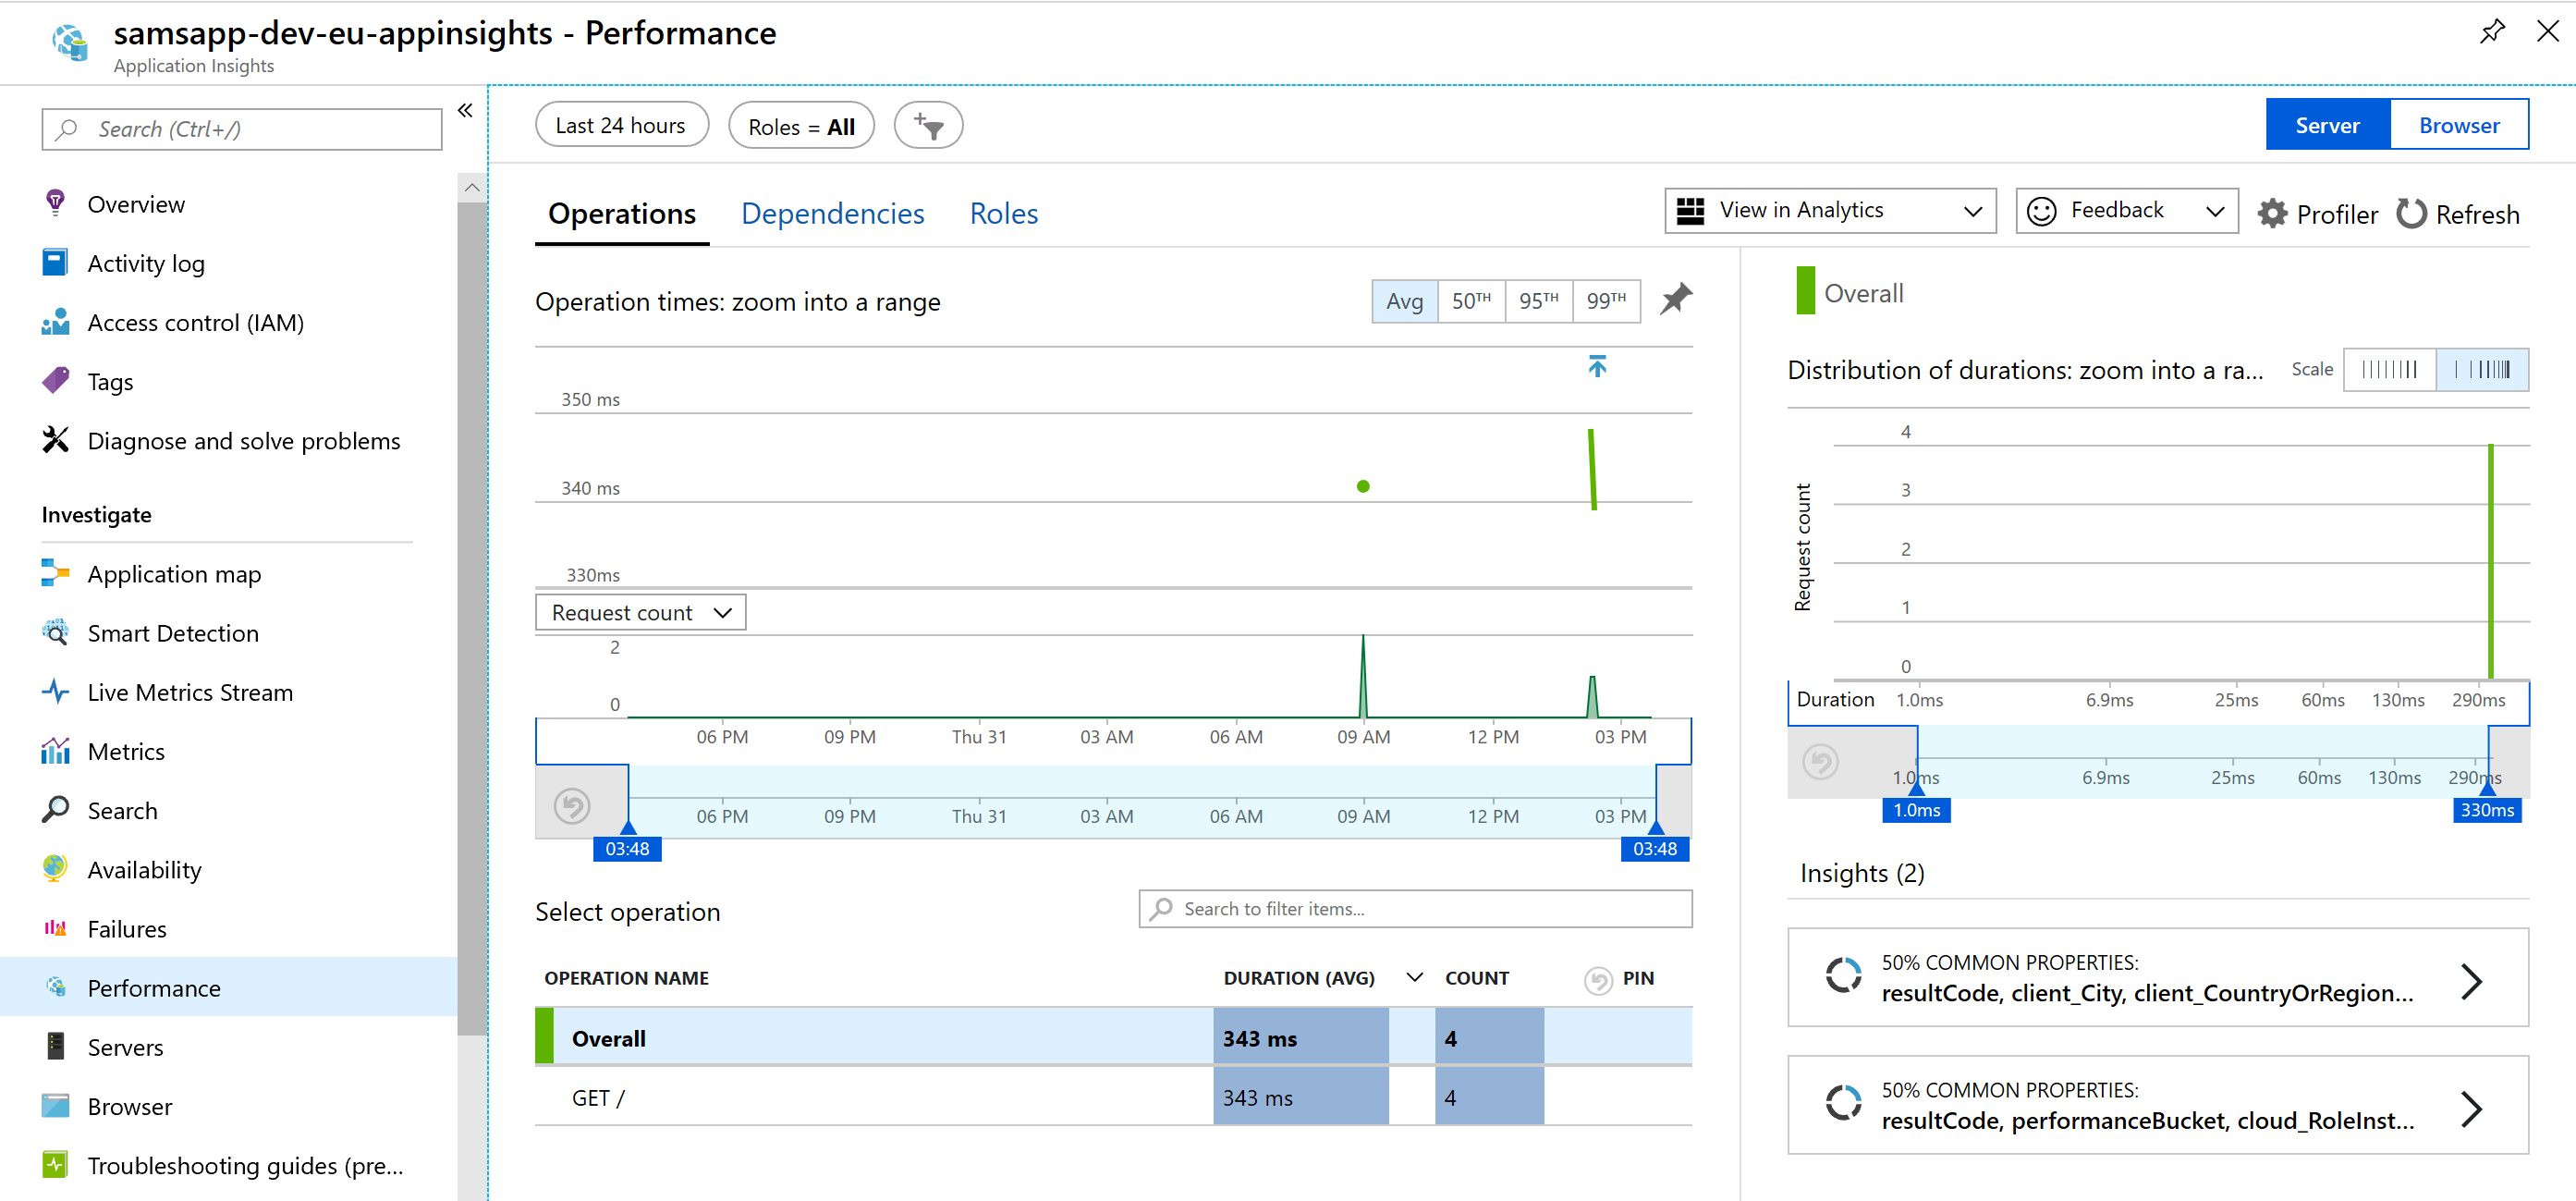
In all of these charts, we can select two parts, selecting a start and end time, and it will zoom in to this area. This is a really useful and powerful feature. Our chart is fairly quiet at this stage as it’s just us testing with a half dozen requests – but we can zoom into a few minutes from 2:23pm to 2:26pm to see if we can find more information about this performance.
Application Map: observe a visual map of how the pieces are connected together and any potential issues. In the past, we have found this useful to confirm that the items we are expecting to be part of this environment are present – for example, that the dev service is using the dev database. In previous projects we’ve come across situations where the prod service was accidentally using a qa database – not a good situation. This Application map is from the documentation, and demonstrates some of the features that are available , including average time to run the dependency, number of calls, and percentage of success – as our application map is boring at this stage (we just have a service that isn’t using any dependencies except Application Insights).

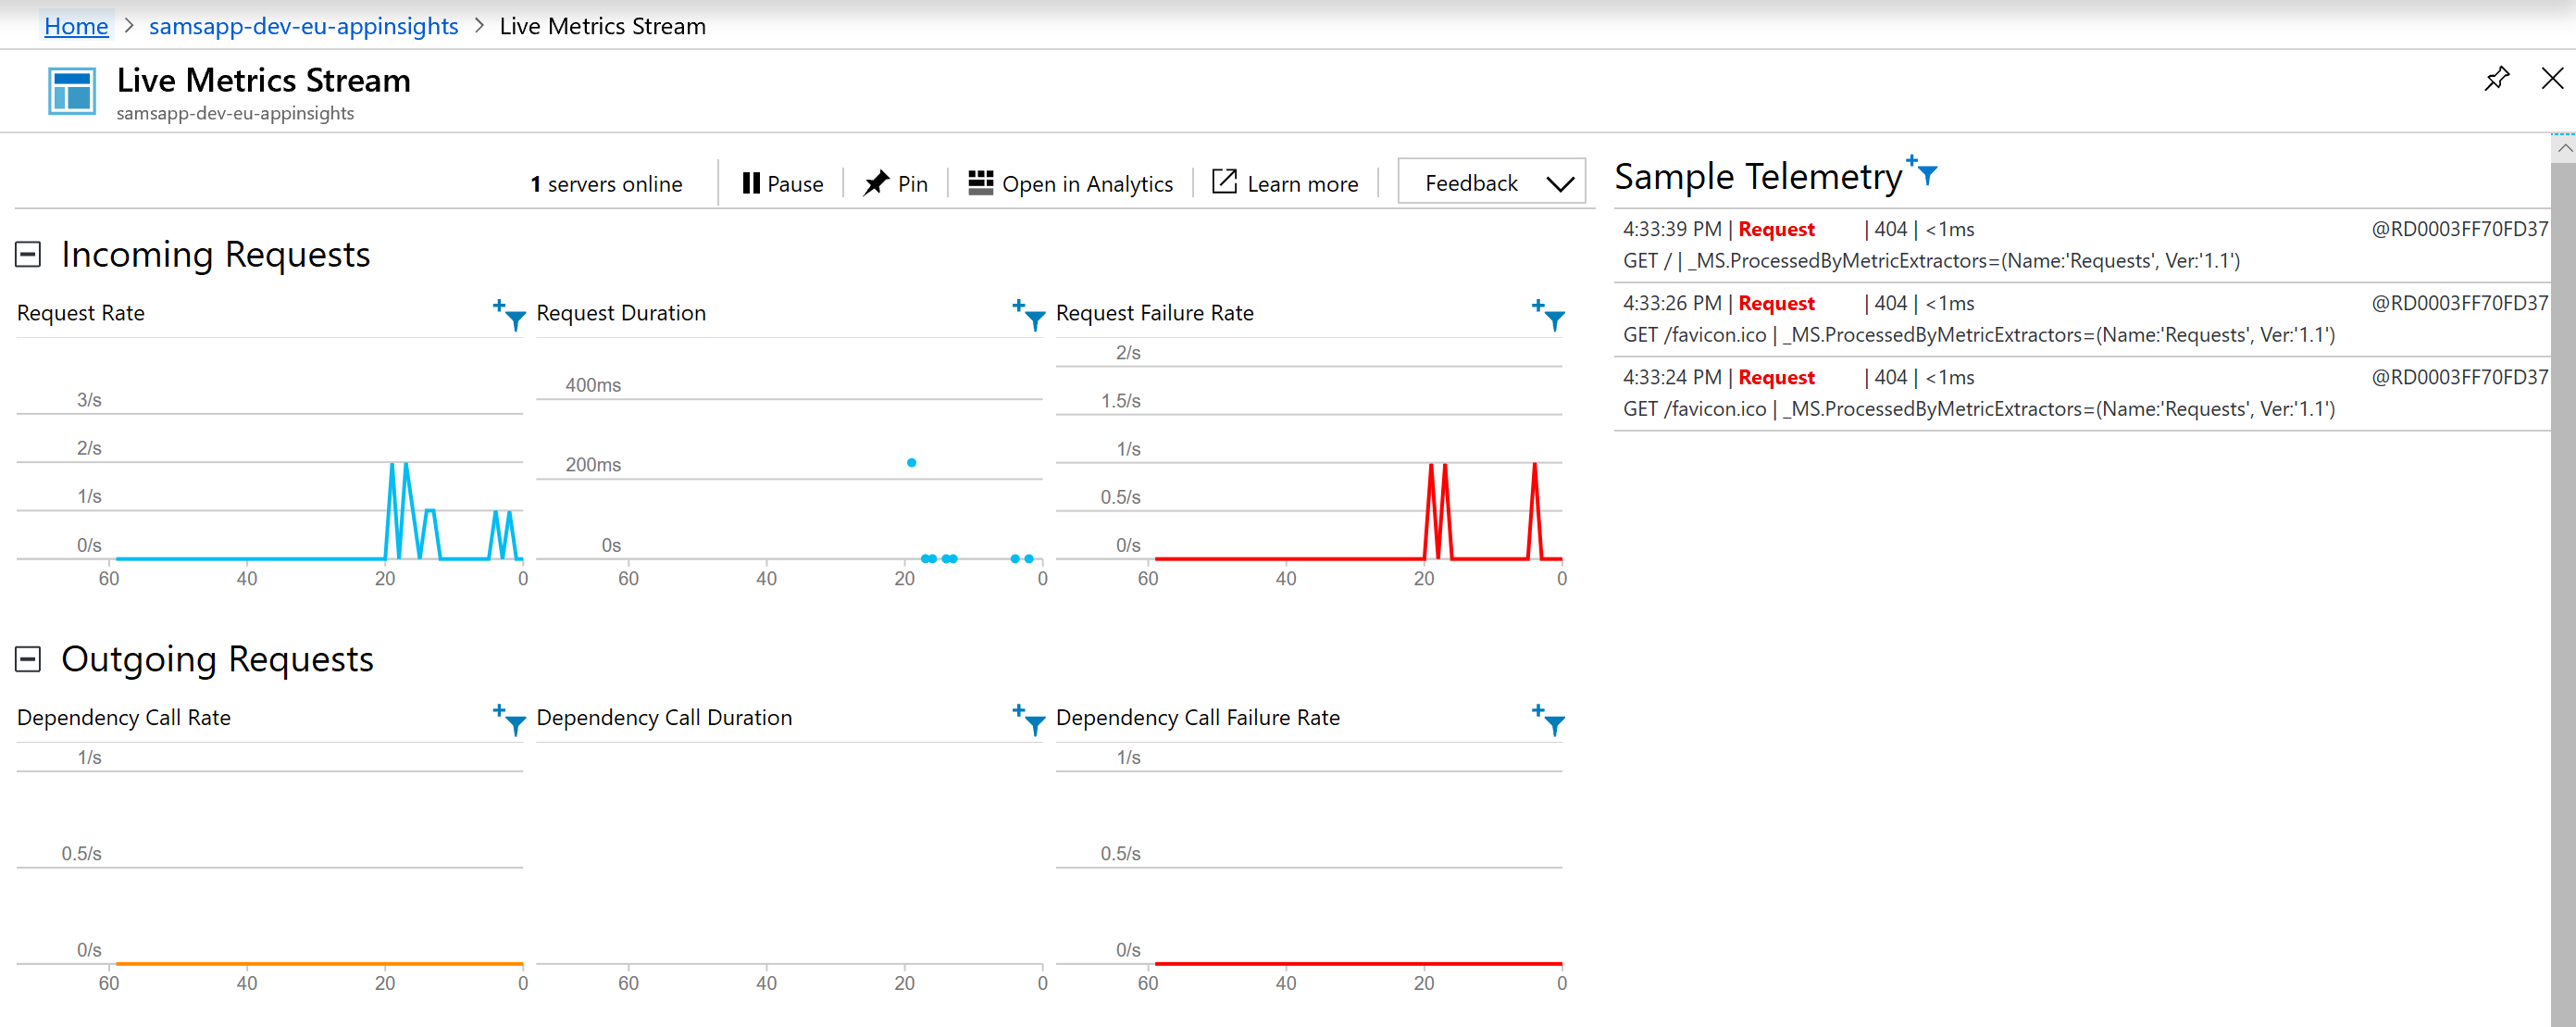
Live Metrics: observe the current state of the application – very useful after a release to ensure that pieces are working how we expect them to work. In this case we browsed to our web service 5 times, with an error in the middle. What is interesting is that we actually have 3 errors here – when we were only expecting one. The two extra errors are how we discovered the missing favicon.ico file we mentioned earlier.
There are so many more features available, including alerts, usage, availability, and browser analytics. As we proceed through this project, we will use more of these features and highlight some real troubleshooting.
Wrapup
Today we learned how to use Application Insights to debug issues, identify errors, and also monitor usage. We learned about how important it can be to help feed items back into our backlog for future sprints. Finally, we learned about different ways to track release events and use different Application Insight features.
References
- Application Insights: https://docs.microsoft.com/en-us/azure/application-insights/app-insights-overview
- How do I … in Application Insights?: https://docs.microsoft.com/en-us/azure/application-insights/app-insights-how-do-i?toc=/azure/azure-monitor/toc.json
- Application Insights and DevOps: https://docs.microsoft.com/en-us/azure/azure-monitor/app/detect-triage-diagnose
- Release Annontations: https://docs.microsoft.com/en-us/azure/application-insights/app-insights-annotations
- Featured image: http://www.navantis.com/wp-content/uploads/2015/01/MangagedMonitoringConsole.png

One comment