

In the highly recommended DevOps book “Accelerate“, deployment frequency is recognized as one of the primary measurements of high performing DevOps teams. But, what does it mean to increase deployment frequency? It initially sounds like a metric that be easily gamed by running our build every 5 minutes. We are going to experiment with this metric and see what happens to our CI/CD process if we run our full pipeline more often. Note that a full pipeline for us runs the build, and then deploys to dev, QA, and finally production.
Deployment frequency is promoted as being important for two reasons:
- It gives the team more feedback. As builds are running more often, there are more opportunities for things to go wrong, creating more data and opportunities to make the pipeline more resilient.
- We are delivering more value to our end users. Updates can be deployed as soon as they are ready for end users (and sometimes, with feature flags, before that!)
Setting up the schedule
To start, we will setup a schedule on our pipeline to run every four hours. There are two methods to setup pipeline schedules in Azure Pipelines. The first is direcly in our YAML, with a “CRON” statement. For example, to run every four hours, starting at 02:00am, we need, (with the schedules keyword in our YAML):
schedules:
- cron: "0 2/4 * * *"
CRON statements are a little odd at first glance, but fortunately there are cron generators out there to help us understand and generate the right schedules.
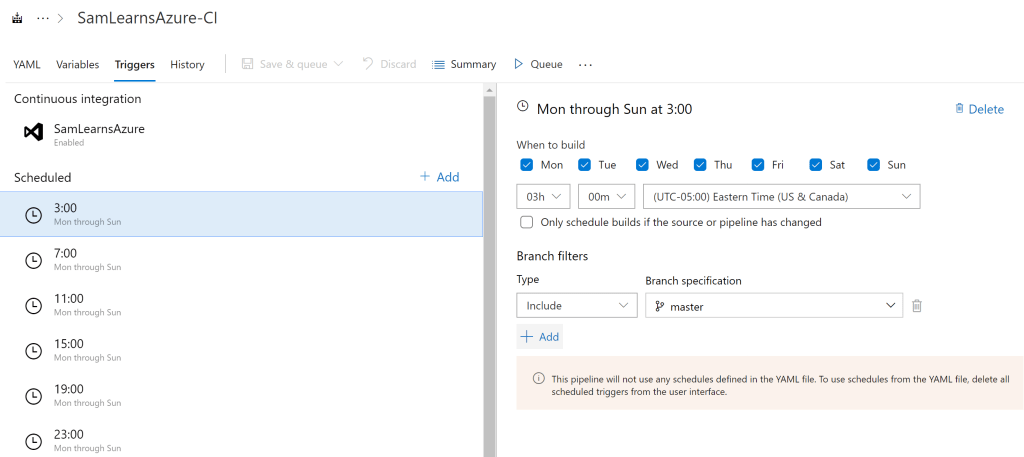
The second schedule option is to use the triggers section in the Azure Pipelines UI. This is easier to understand, but clunky to maintain. This option is available even for YAML pipelines, but note that these triggers will override any CRON schedules set in the YAML. We used this as a testing ground, with the plan to delete and move the logic into the YAML after testing is complete. The example below sets up a schedule running every four hours starting at 3am.
Initial results and database contention
We ran our pipeline every 4 hours for about four weeks, and were surprised to see only a 75% success rate. 75% is pretty far away from 100%… Looking into the errors we started to learn a lot about our pipeline.
We noticed right away that the 2am build was consistently failing every day. Digging in a bit deeper, we discovered a race condition with our daily database restore that we also run every day at 2am on Dev and QA. Not a big deal, we adjust the timing, so that the 4 hour window doesn’t fall exactly at 2am, moving the schedule to start at 3am, running every 4 hours.
Using Pipeline analytics
Our pipeline pass rate was now running at around 88%, but we were receiving what appeared to be fairly random errors. At this stage, we decided to amp up the feedback, and increase the pipeline frequency to run the build every two hours, (starting at 1am to avoid the 2am database restore). With the pipeline now running 12 times a day, we also start to use the analytics section of our build to see pipeline failure trends. Let’s look at the last “14 days” view first, after two weeks.
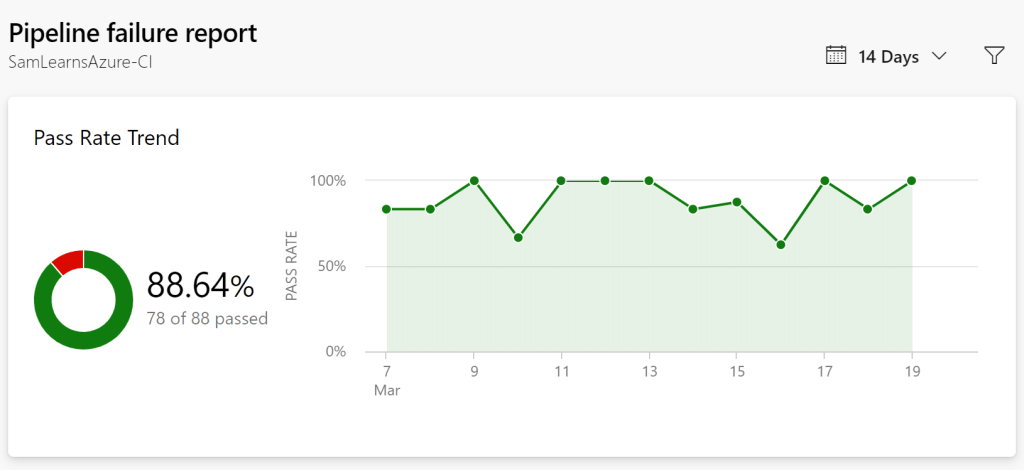
Our pass rate is still hovering around 88%, but now we can see the type of task and can start to see some patterns.

Out of the 11 failed builds shown above, 4 of them are related to some integration tests failing in a feature we were building. Let’s take these out of the equation for now. What is left? 6 failures in the ARM template deployment, and one failure when updating the GoDaddy DNS settings.
ARM Template SQL Auto-tuning failures
The ARM template errors were all related to an automatic “server automatic tuning settings” error. Further investigation shows that we accidentally are using an advisor feature that is not supported in ARM Templates. We elect to remove the advisor from the ARM templates, as we can enable auto-tuning with other methods.
Go Daddy failures
The GoDaddy one error was a “503 Service Temporarily Unavailable” error. We have seen this from time to time, and fire off an email to GoDaddy support for more information. As it’s a dependency we don’t have much control over, and don’t need all the time, we will add a “continueOnError: true” to our YAML. When this fails in the future, the pipeline won’t fail, but will pass with an orange warnings. It’s important to use these exceptions with care – if we use them everywhere, we won’t understand what is failing.

Our final YAML schedule
In the final YAML, there are a few other options we need to add. First, we only want the schedule to run on the main branch to reduce noise – we want our analytics to represent the main branch of truth, and allow developers to experiment on their feature branches. Secondly, we need to set the “always” flag to “true”. This runs the pipeline even if there have been no source code changes since the last successful scheduled run. The default of “always” is “false”, (only run when source code has changed), so this is a useful tweak for us.
schedules:
- cron: "0 1/2 * * *"
  branches:
    include:
    - master
  always: true
Conclusion
With three months of data, hundreds of a pipeline runs a month, we have created a much more robust pipeline that fails only once or twice a week, translating to a 98-99% success rate. This post took a bit longer than we thought, but our pipeline is much more resilient. We are still working on those last build failures, but we need more time to find patterns and design the best solution. With plenty of data to review, we can prioritize and make useful decisions to tackle the most important problems in the future.
Did increasing deployment frequency make our pipeline better? Absolutely, 200% yes. We highly recommend running through the exercise yourself. Please let us know what your experience is.
Update: I’ve starting working on a POC in GitHub to measure these in Azure DevOps and GitHub: https://github.com/samsmithnz/DevOpsMetrics
References
- High performing DevOps teams: “Accelerate” by Nicole Forsgren, Jez Humble, Gene Kim. Highly recommended!
- YAML schedule keyword: https://docs.microsoft.com/en-us/azure/devops/pipelines/process/scheduled-triggers?view=azure-devops&tabs=yaml
- Cron generator: https://www.freeformatter.com/cron-expression-generator-quartz.html
- Auto tuning in ARM Templates (not supported! use the SQL): https://stackoverflow.com/questions/46497300/enabling-azure-sql-database-automatic-tuning-via-arm
- Featured image credit: https://cdn.lynda.com/course/421800/421800-637199599552245144-16×9.jpg

2 comments