

In the most excellent DevOps book, “Accelerate“, four metrics were identified as being most important in identifying high performing DevOps teams. We will look at what the metrics are, how to measure them, what a high performing team looks like, and how these numbers look in our demo project. We are also going to look at how we could manipulate the metrics, and investigate if these metrics are fool proof. For example, velocity is relatively easy to “game”, we only need to increase our story points every sprint… right?
All four of these metrics are based on production environments, where the value to our end users is delivered:
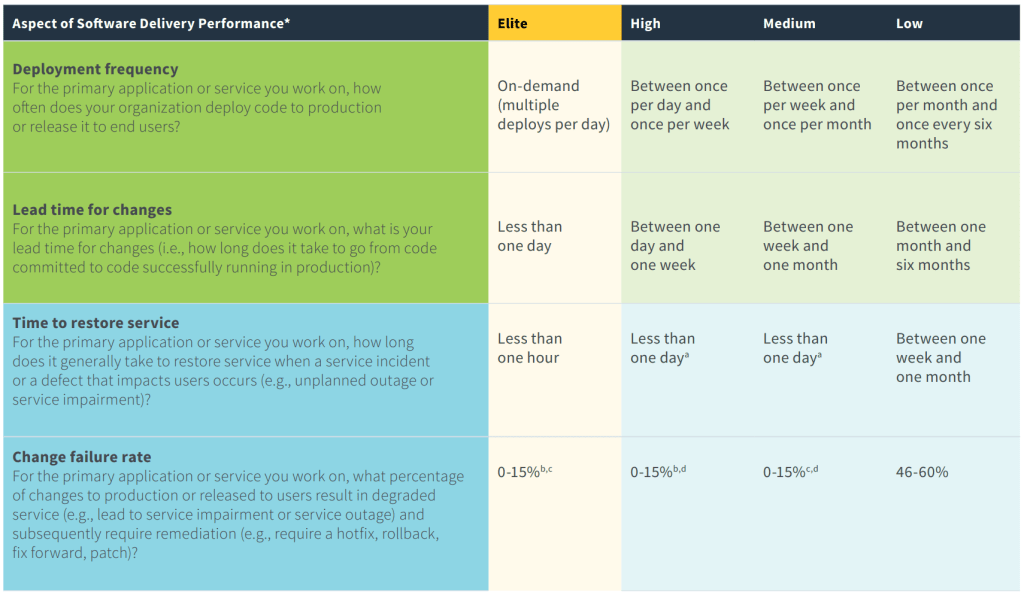
- Lead time for changes: Time from committing a change to deployment to production
- Deployment frequency: How often we deploy to production
- Mean time to restore (MTTR): How quickly we can restore production in an outage or degradation
- Change failure rate: after a production deployment, was it successful? Or did we need to deploy a fix/rollback?
Lead time for changes
“Lead time for changes”, is the time it takes from editing a line of code, to deploying it to production. There are no shortcuts, we follow our complete process, with all testing and checks needed to complete the deployment to production. This is all about speed: if you change a single line of code and commit the change, how long does it take before that change is deployed to production?
How do we measure this? We measure the total time from the commit/check in, and follow it until deployment to production. We have selected the commit as the starting point of the measurement, as it’s constant and doesn’t change. Development can be complicated, by removing the development time from this equation, we have a constant measurement of our automated process time.
What does a high performer look like? Elite performers have a process time of less than one day. High performers are measured in days (less than a week), and low performers are measured in months.
How could this be gamed? The most likely workaround is skipping steps, for example, having minimal, or no tests. However, this would decrease our confidence in the quality of our pipeline. This is a robust metric if there is a mature DevOps process in place. If the DevOps process is not robust, we are likely to deploy a lot of broken builds to production (see change rate failure below).
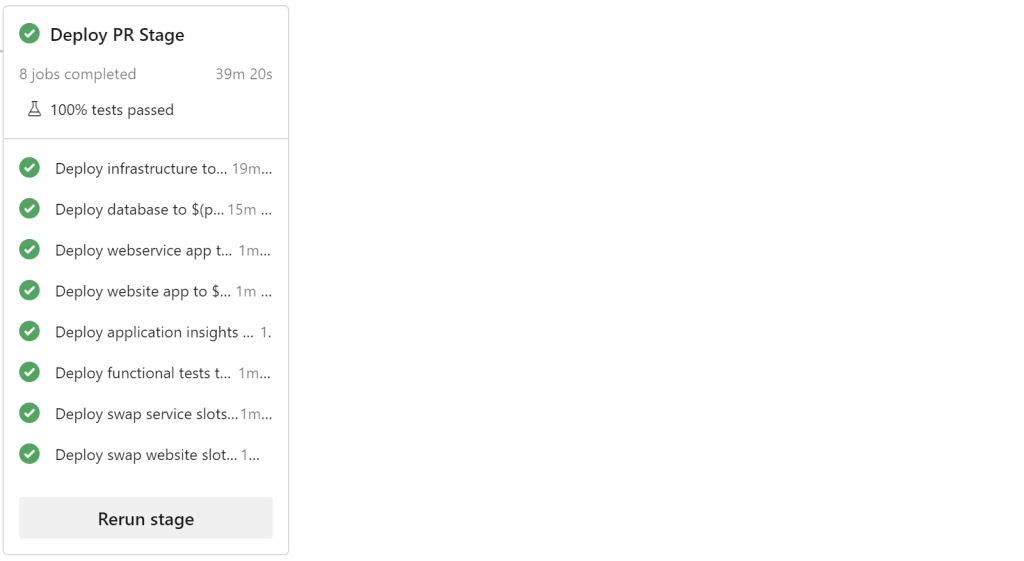
How are we doing? In SamLearnsAzure, it takes a total of 40-45 minutes. 7 minutes to run CI, and then roughly 11 minutes each for Dev, QA, Production. We are a high performer.
Mean time to restore (or MTTR)
“Mean time to restore” is the duration to restore an environment after failure. How resilient and quickly can your product recover when a service fails? Is there an automatic fail-over process setup to fail-over to another region? If your production database and website are deleted, how long does it take to restore them? What if the Azure region has an outage?
Some organizations use “chaos engineering” to continually test resiliency, by randomly deleting and re-configuring resources. The most well known example is “Chaos Monkey“, a product developed by Netflix. This runs in production, and helps the team finds potential situations that can cause service outages – in turn, helping to decrease MTTR. The confidence and scale required to run these in production requires very mature systems.
How do we measure this? There are a couple options to consider:
- We measure the worst case scenario, complete deletion of the production environment.
- We track individual service performance in a central location. Azure Monitor will help here. Some systems setup monitoring on resources until a degradation is detected and then use a custom system to track the degradation. When detected, a value will be stored in a database with the starting date/time. When the resource returns to an acceptable performance, an end date/time is added to the database – therefore giving us a start and end time for the degradation, and a restoration duration.
How could this be gamed? As we have an acceptable base line for what acceptable performance is, this one is difficult to game.
What does a high performer look like? An elite performer can restore service in less than one hour. A high performer can resolve the issue in less than a day. A low performer needs between a week and a month.
How are we doing? We are *just* an elite performer, as typically we can restore environments in less than an hour. We do have some weak points – for example, all of our resources are in one region, and we haven’t setup multiple region redundancy for cost reasons. If we had more resourses, (e.g. people, $$$, time), we could certainly reduce this by a relative percentage to reach a restoration time of minutes.
For example, let’s look at a deployment to create a new resource group and all of the items in it. We can measure this when we create a new PR environment, which today takes roughly 40-45 minutes, compared to a deployment to an existing environment of roughly 10-15 minutes. This extra time is related to the provisioning of new resources, and restoring the database.
Change failure rate
Change failure rate is the percent of changes to production that require an immediate fix to resolve the issue. We found this metric more complex than the others and harder to measure within existing systems. If the issue generates an error, it’s very easy to track. But what if the issue affects performance? It’s also important to differentiate feedback from an issue. Sometimes when we deploy, we immediately receive feedback about the feature, and prioritize an update to improve the feature.
How do we measure this? We need to track whether a deployment was successful or not. This is not cut and dry, and the hardest of the metrics to track in code, because a deployment can look successful from a tools perspective, but have bugs after the fact. However, we need a clear definition of what types of issue is considered a failure. Clearly a bug that results in a 500 error is a problem. But what about a CSS issue that results in text overlapping with other text? What if the deployment appears perfect, but then later causes a performance degradation to a certain part of the app?
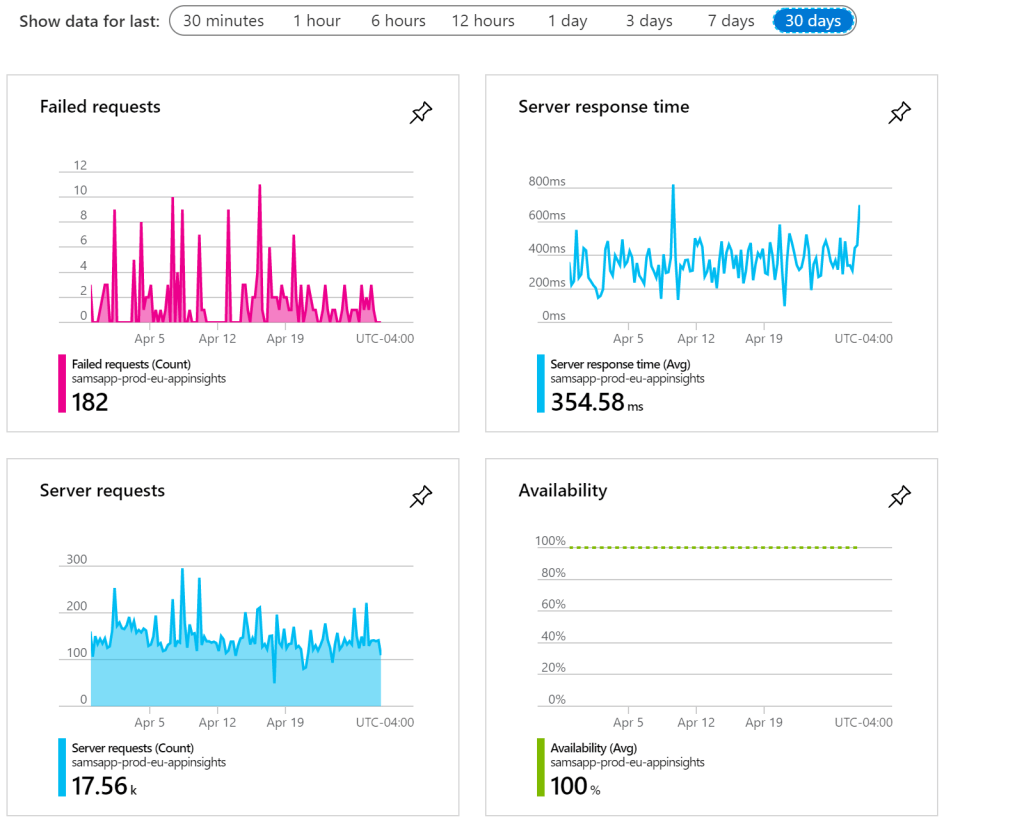
To solve this, we are going to use our Application Insights dashboard. The dashboard shows a good variety of failed requests, server response time, server requests, and availability. We are looking for an increase in failed requests, and/or an increase in server response time, relative to the server request volume. Site availability is important too. This is a bit subjective sometimes, but is a great opportunity to define base-line metrics and create alerts when these metrics exceed thresholds.
How could this be gamed? It depends how we decide to measure it, but it’s difficult to argue with Application Insights metrics. On the other hand, if there isn’t an obvious bug, a subjective decision has to be made: was this considered a failure or not?
What does a high performer look like? Elite and high performers have a change failure rate of 0-15%. Low performers have 46-60% (or more!).
How are we doing? We have a high performing failure rate, roughly between 5-10%, but this isn’t a metric we currently actively track.
Deployment Frequency
Deployment frequency is a measurement of how often we deploy to production. While we covered deployment frequency extensively a few weeks ago, we think it’s valuable to revisit in this context. The more often you deploy to production, the more we can be sure we have a resilient pipeline that can handle edge cases.
How do we measure this? This one is relatively straight forward, we sum up the number of successful deployments to production.
How could this be gamed? On the surface, this looks very easy to manipulate, but in practice, if good DevOps practices are being followed and quality is high, this is difficult. There is a balance here, as in theory we could setup our deployments to run every 5 minutes. But can you make changes and be confident that your product is of a high quality? Are automated tests capturing all of the issues? Can your CI/CD process handle this volume? Can your production servers handle this deployment volume? Is there a cost involved in deployment? With hosted agents in Azure Pipelines, we usually purchase a number of minutes per month – this is a limited resource we need to use wisely. If the volume is too high, we could potentially consume all build minutes in a few days.
What does a high performer look like? Elite performers can deploy multiple times a day or on demand. High performers have a deployment frequency once per day to once per week, and low performers have a deployment frequency that is measured in months.
How are we doing? We are Elite! We deploy SamLearnsAzure 12 times a day, every 2 hours, currently with a 97% 14 day pass rate, the highest we’ve ever had.
Conclusion
We now have a better understanding of what the important metrics for high performing DevOps teams, how to measure them, and why they work so well. There are a lot of interesting ideas here.
Many of these metrics will expose issues in your pipeline as you scale up. This is the perfect opportunity to embrace continuous improvement and learning. When increasing deployment frequency causes the change rate failure to increase, we need to invest more time in automated testing. When we have a service degradation and the MTTR is outside of our SLA, we need to invest time in making our product more resilient. This is a constant and evolving back and forth, not a single project.
On a personal note, while our DevOps process is far from perfect, it is encouraging to see it performs very well in all of the high performing metrics – clearly we are doing something right, and we hope you can too.
Update: We started a project in GitHub, to create a POC to measure these metrics in Azure DevOps and GitHub: https://github.com/samsmithnz/DevOpsMetrics
References
- High performing DevOps teams: “Accelerate” by Nicole Forsgren, Jez Humble, Gene Kim.
- Accelerate State of DevOps 2019 report: https://services.google.com/fh/files/misc/state-of-devops-2019.pdf
- Featured image credit: https://uscan.gehealthcarepartners.com/Upload/BlogArticle/636288128417936406.jpg?h=396&w=689&mode=crop

Hi Sam,
This is awesome. I love how the website shows the metric and project based data. It would help if you can give some insight/readme if I can customize the source to run locally/on azure on my devops organization. Thanks.
Regards,
Anu
LikeLike
I’m working on it! Check out https://github.com/samsmithnz/DevOpsMetrics!
LikeLike
Hi Sam, great article. We have Azure DevOps as our VC and I’ve forked your DevOps metrics project to start collecting DevOps metrics. You have mentioned in the readme that DevOps is on hold. I’m not a C# guy but could you tell if we can get any metrics out for Azure DevOps or its only Github at the moment?
LikeLike
Azure DevOps is definitely not dead – I just don’t have the capacity – I’m one person. Would you be willing to submit a PR? More people have posted here: https://github.com/DeveloperMetrics/DevOpsMetrics/issues/83
LikeLike
sure, I will revert on the PR and many thanks for your response but I have deployed infra by running ps script and ran the dotnet GitHub pipeline but it failed on create release step. I can now metrics from your repos (azure and GitHub) when I browse my deployed web app. Is it possible to get any metrics from my own azure devops? Like I can see your ADO metrics? I’m not a developer only DevOps guy mainly with ADO
LikeLike